Figure 3.
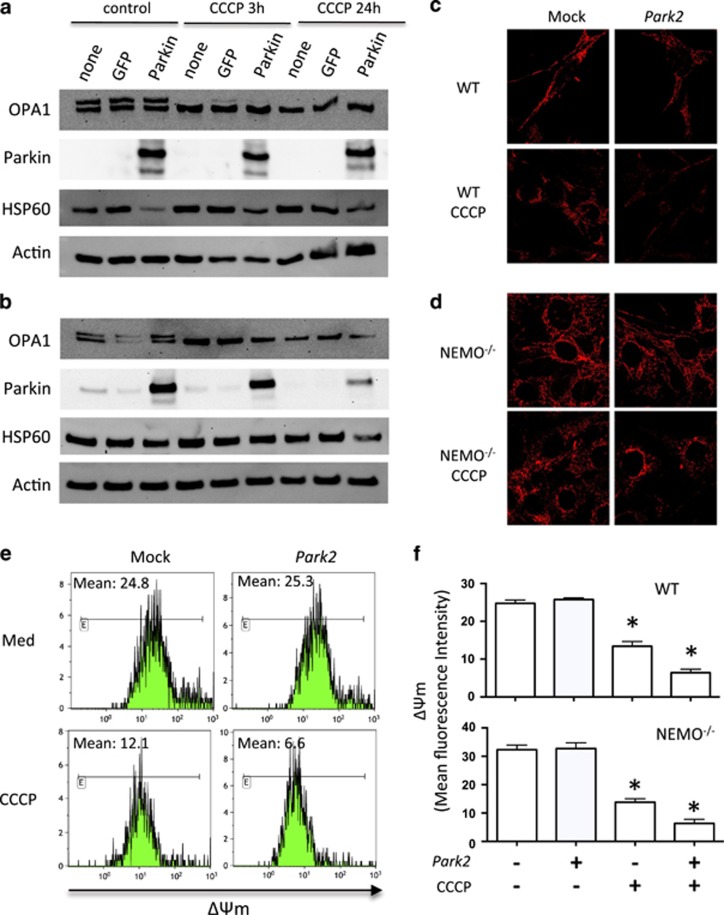
Park2 overexpression in stressed MEF cells. (a) Profile of OPA1 expression in WT and (b) NEMO−/− MEFs. Cells were transfected with Park2 at a dose of 1 μg. OPA1 expression was assessed at 3 and 24 h in the absence or presence of CCCP. Hsp60 and actin were used as loading controls to normalize protein content. (c) WT and (d) NEMO−/− MEF cells were stained with specific antibodies directed against Hsp60 (in red). Mitochondrial network was analyzed after overexpression of Park2 in the absence or presence of CCCP after 24 h. (e) Mitochondrial membrane potential of WT MEF cells assessed by flow cytometry in the absence or presence of CCCP. (f) Histograms of ΔΨm from WT and NEMO−/− MEF cells (mean fluorescence intensity) of transfected Park2 cells in the absence or presence of CCCP. Mean±SD of three independent experiments; *P<0.05

