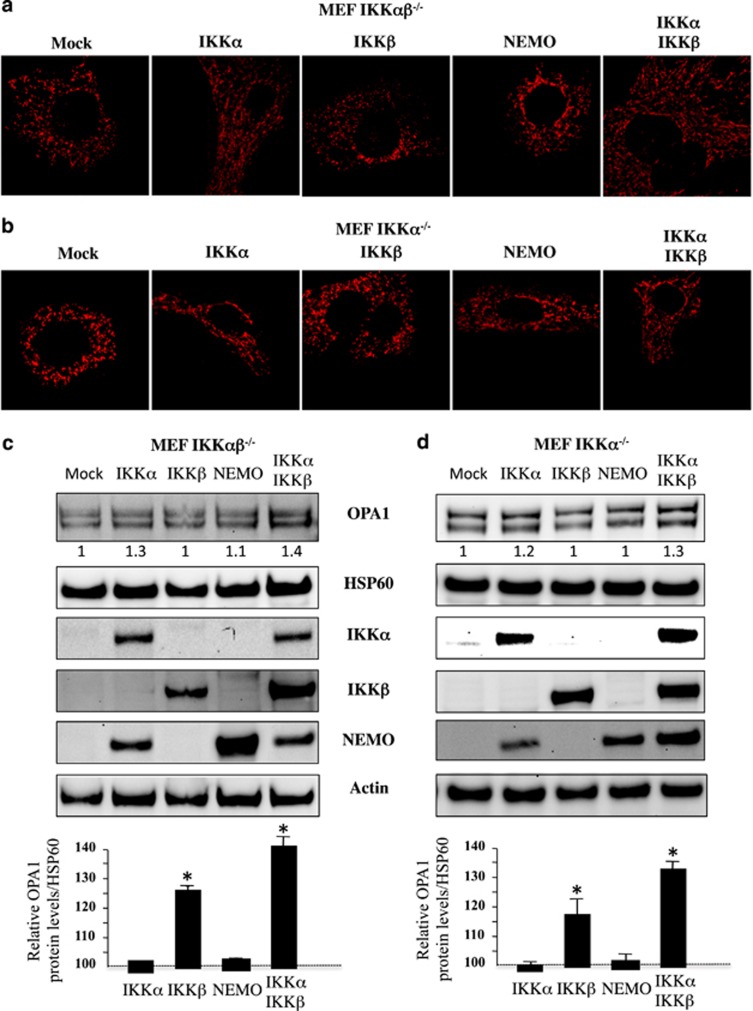
Figure 5.
Mitochondrial network fragmentation and OPA1 expression. (a, c) IKKαβ−/− and (b, d) IKKα−/− MEF cells were transfected with plasmids encoding for IKKα, IKKβ, NEMO, or both IKKα+IKKβ at the dose of 1 μg, mock serves as a control. (a and b) After overnight culture, cells were stained with specific antibodies directed against HSP60 (in red) and mitochondrial fragmentation was analyzed (c and d) OPA1 expression. As control Hsp60 was used as loading control to normalize protein content. Furthermore immunoblots were probed with specific antibodies to IKKα, IKKβ, and NEMO. Actin was used as a control. Mean±S.D. of three independent experiments; *P<0.05

