Figure 3.
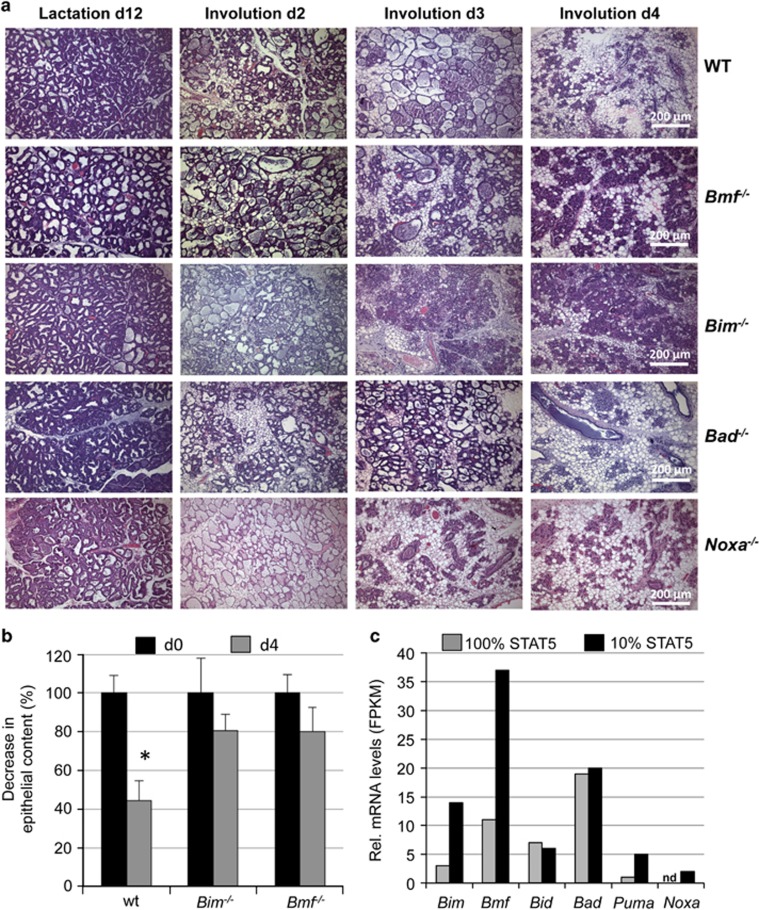
Impact of BH3-only protein loss on mammary gland remodelling in involution. (a) Representative images of H&E-stained mammary gland #2, 3 or #4, five sections from mice of the indicated genotypes per time point, after forced weaning. 3–6 individual mice/genotype were analysed for each time point. (b) Quantification of epithelial cell loss during involution using ImageJ-Fiji software, as described in the methods section. Bars represent means ±S.E.M. of glands from 4–6 animals per genotype. *indicate statistically significant differences between days 0 and 4 as assessed by paired Student's t-test (P<0.05). (c) Relative mRNA expression levels are displayed as Fragments Per Kilobase of exon per Million reads (FPKM) of individual BH3-only proteins assessed by RNA-seq analysis comparing epithelial cells from MMTV-Cre+ wt (100% STAT5 activity) or Stat5af/f Stat5b+/− mice (<10% STAT5 activity)40

