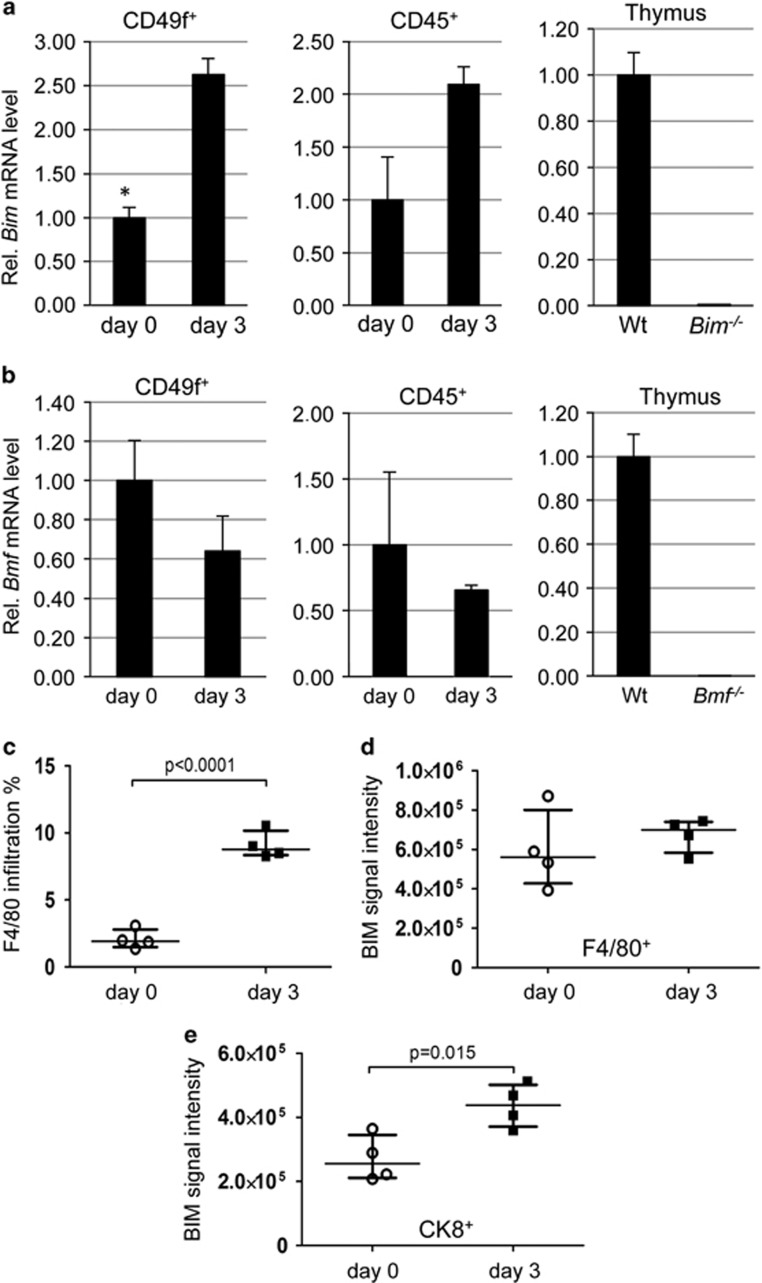
Figure 4.
Increased Bim mRNA and protein in mammary epithelium during involution. qRT-PCR analysis of (a) Bim or (b) Bmf mRNA in sorted CD45+ haematopoietic or CD49f+CD45− epithelial cells isolated on day 0 or day 3 of involution. Bars represent means ±S.D. of two independent experiments performed in duplicates. RNA derived from wt, Bim- or Bmf-deficient thymocytes was used as reference. (c) Quantification of macrophage infiltration during involution (see also Supplementary Figure 4) (d and e) Quantification of relative BIM expression levels as assessed by immunofluorescence analysis shown in Supplementary Figure 4. Bars represent means ±S.D. Four IF-images per gland, derived from two mice per genotype were analysed (see also Supplementary Figure 4 for representative images and image quantification procedure). *indicates statistically significant differences between days 0 and 3 as assessed by paired Student's t-test (P<0.05)

