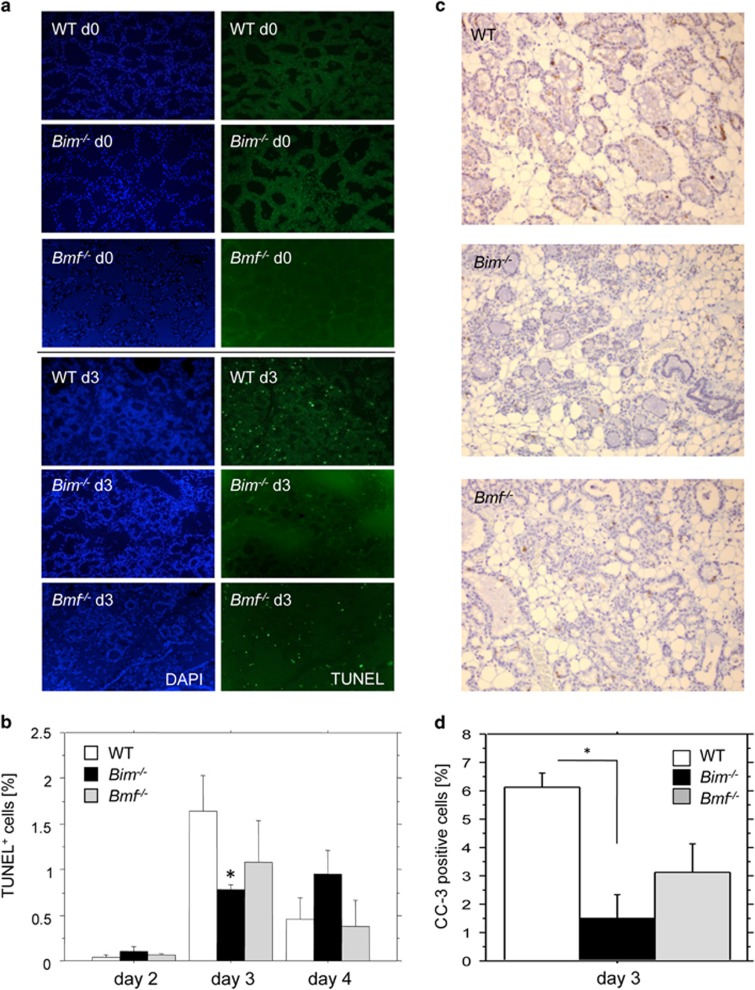
Figure 5.
Loss of Bim delays apoptosis during involution. (a) Representative examples of immunofluorescence-based TUNEL analysis performed on mammary gland #4 sections from tissue isolated on day 0 or day 3 of involution from wt, Bmf−/− or Bim−/− mice. (b) Quantification of samples shown in a. Bars represent means ±S.E. of n=3 mice per day and genotype analysed. (c) Representative examples of immunohistochemistry-based analysis of caspase-3 activation performed on mammary gland #4 sections from tissue isolated on day 0 or day 3 of involution from wt, Bim−/− or Bmf−/− mice. (d) Quantification of samples shown in c. Bars represent means ±S.E.M. of n=3 mice per day and genotype analysed. *indicates a statistically significant difference between wt and Bim-deficient mice, as assessed by unpaired Student's t-test (P<0.05)

