Figure 3.
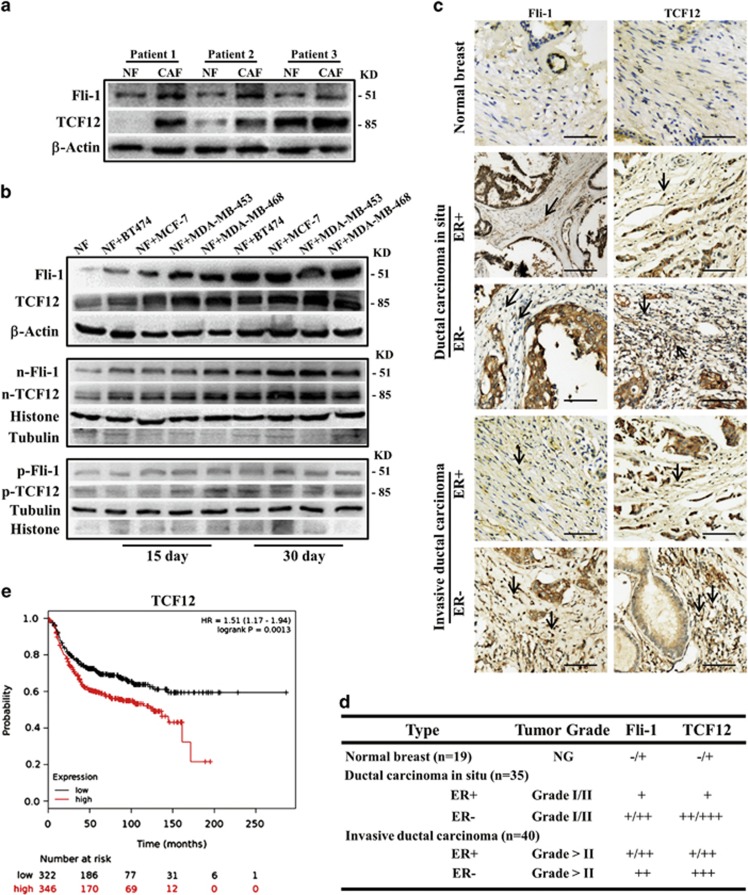
Fli-1 and TCF12 expression levels are upregulated in breast tumor CAFs. (a and b) Western blot analysis of (a) endogenous Fli-1 and TCF12 protein expression in paired NFs and CAFs from three random patients or (b) total, nuclear and cytoplasmic Fli-1 and TCF12 protein expression in NFs co-cultured with four different breast cancer cell lines (BT474, MCF-7, MDA-MB-453 and MDA-MB-468) for 15 or 30 days. β-Actin, histone or tubulin was used as a loading control. (c) IHC staining for Fli-1 and TCF12 expression in breast specimens. The arrows indicate distinctly stained fibroblasts in the representative tumor tissues. Scale bars, 200 μm. (d) Summary of IHC staining for normal, ductal carcinoma in situ and invasive ductal breast carcinoma samples. The nuclear staining intensities were categorized as low (+), medium (++), or high (+++) based on observations of 80% of the cell population. NG, not graded. (e) The Kaplan–Meier survival analysis revealed an association between poor prognosis in ER- breast cancer patients and TCF12 expression

