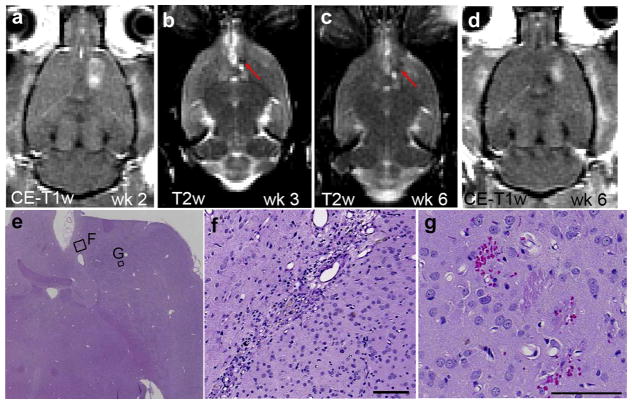
Fig. 4.
Representative magnetic resonance images and histology of an animal with a hypointense lesion on T2-weighted imaging (T2-WI). (a) Contrast-enhanced T1-WI showing blood–brain barrier (BBB) disruption after the second session (ΔSI = 14.2%). BBB disruption was successful for each session using an acoustic pressure of 0.73 MPa. (b and c) In the following weeks a hypo-intense spot was observed on T2-WI (red arrows). Note the hyper-intensity adjacent to the hypo-intense spot is the ventricle. (d) Contrast-enhanced T1-WI showing BBB disruption after the sixth session (ΔSI =15.7%). (e) On the hematoxylin & eosin (H&E) section, two separate areas were present with different histopathological features, presumably the result of the sonication in different sessions, with higher magnifications shown in (f) and (g). (f) The affected area includes a small (1.8 × 0.2 mm) scar and a few hemosiderin particles. (g) Affected area that shows a few scattered petechiae probably produced during the last BBB disruption session (e–g: H&E). Scale bars: 0.1 mm.

