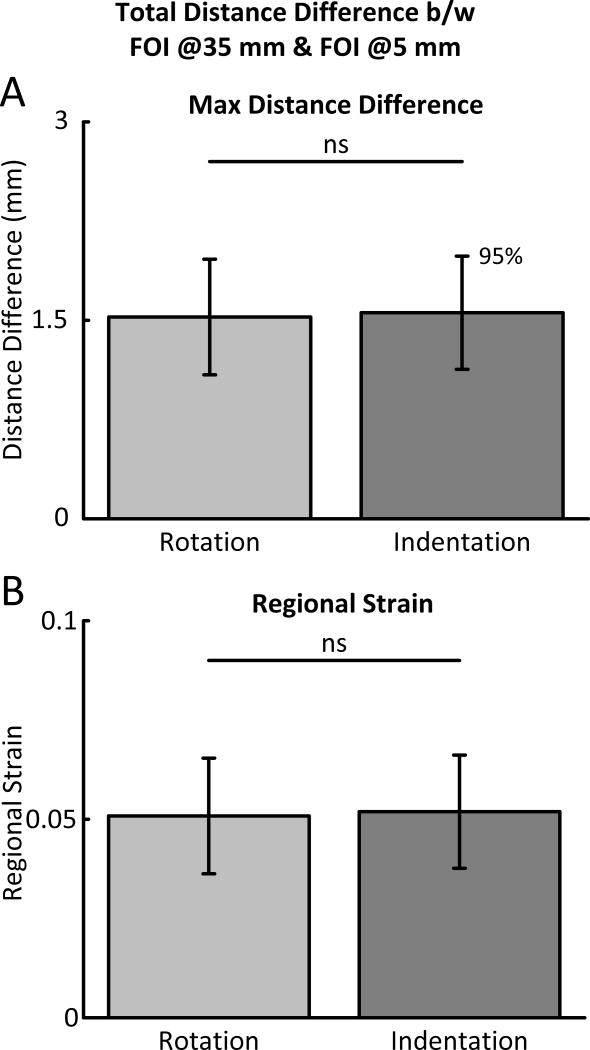
Fig. 5.
Bar plots of the maximum distance difference and regional strain as calculated from the FOI @ 35 mm and the FOI @5 mm. The solid black line above the bars represent the statistical link between the bars and ns stands for: not significant. (A) Shows the Maximum Distance difference between the FOI @35 mm and the FOI @5 mm for both the Rotation and Indentation protocol. (B) Shows the same information as (A) however the information has been normalized by the initial length between the two FOIs of 30 mm.

