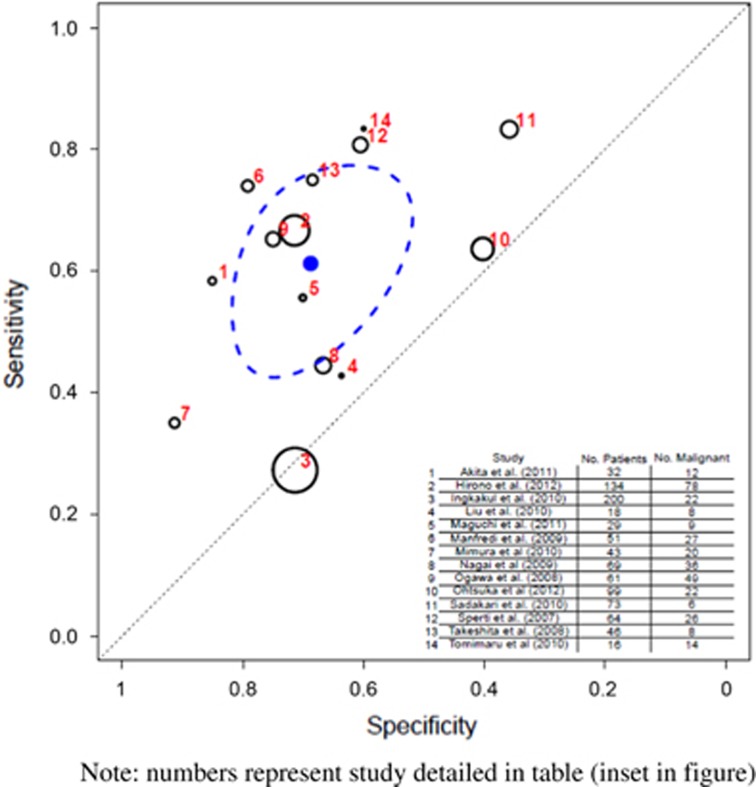
Figure 7.
Hierarchical summary receiver operator characteristic (HSROC) curve of prediction of malignancy by main pancreatic duct (MPD) dilation on imaging (all intraductal papillary mucinous neoplasia (IPMN) types). Note that the numbers represent the studies detailed in table (inset in figure). The black circles represent the individual study estimate, and vary based on study size. The blue circle stands for the overall estimate pooling all studies, and the dotted blue line indicates the 95% credibility interval.

