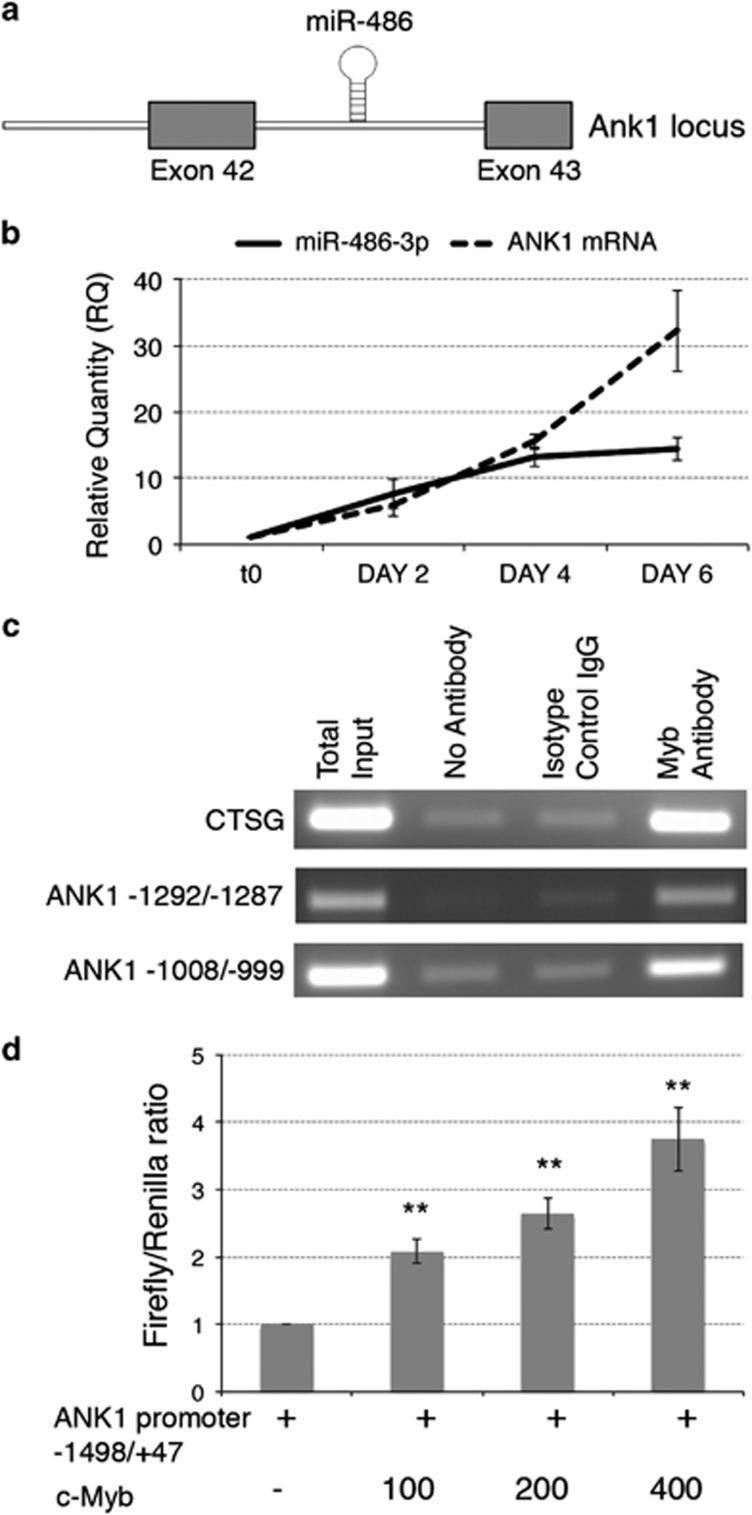
Figure 1.
MYB-driven regulation of the ANK1 gene and the embedded miR-486-3p expression. (a) miR-486 is under the transcriptional regulation of the ankyrin 1 (ANK1) locus; data from UCSC Human Genome Browser-hg19 assembly. (b) miR-486-3p and ANK1 expression kinetics during erythroid differentiation of CD34+ cells. The expression levels of miR-486-3p and ANK1 mRNA were monitored by qRT-PCR at different culture time points after the EPO-driven induction of the erythroid differentiation in CD34+ cells. miR-486-3p mature miRNA and ANK1 mRNA levels were normalized versus housekeeping U6 snRNA and HPRT1 mRNA, respectively, and are reported as RQ respect to CD34+ cells at time 0 of treatment with EPO, which was set as calibrator. P≤0.05 at day 4 and day 6 compared with t0 for both miR-486-3p and ANK1. (c) ANK1 promoter-specific PCR performed in a representative ChIP experiment. PCR data are reported for both the putative MYB binding sites with the highest computational prediction scores (i.e. −1292/−1287 and −1008/−999, see Supplementary Table S5 for further details). ChIP and PCRs were performed in triplicate. (d) MYB transactivation of ANK1 promoter-driven luciferase expression. The amounts (in ng) of co-transfected plasmids are reported. Renilla-normalized Firefly luciferase levels (mean±S.E.M.; n=5) are normalized by setting the pXP1-ANK1(−1498/+47)/pCMV6XL5 empty vector-transfected sample as=1. Error bars represent S.E.M. **P≤0.01 compared with pXP1ANK1(−1498/+47)/pCMV6XL5 empty vector-transfected sample. n=number of experiments

