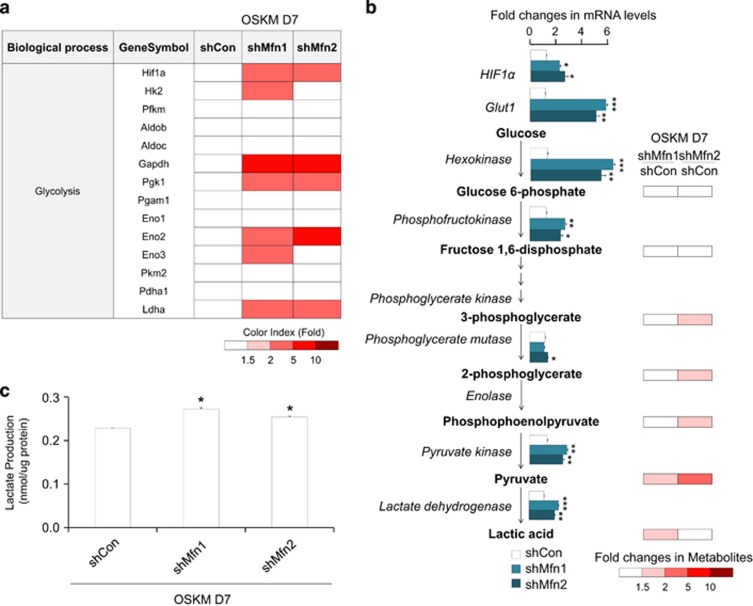
Figure 4.
Mfn1/2 knockdown facilitates glycolytic conversion in early-stage reprogramming. (a) Transcriptome analysis of gene sets related to glycolysis in MEFs transduced with OSKM and the indicated shRNAs on D7 of reprogramming. The ratios are indicated by a color-coded index bar. (b) The expression of genes encoding major enzymes (left) and the relative quantity of each metabolite (right) related to glycolysis were determined via real-time PCR analysis and capillary electrophoresis time-of-flight mass spectrometry, respectively. The fold changes of metabolites in Mfn1/2 shRNA-transduced reprogramming cultures compared with the control at D7 are represented by a color-coded index bar. (c) Lactate production was determined in the cell lysates of each group. The data are presented as the mean±S.E. (n=3). *P<0.05; **P<0.01; ***P<0.001 (Student's t-test)

