Figure 1.
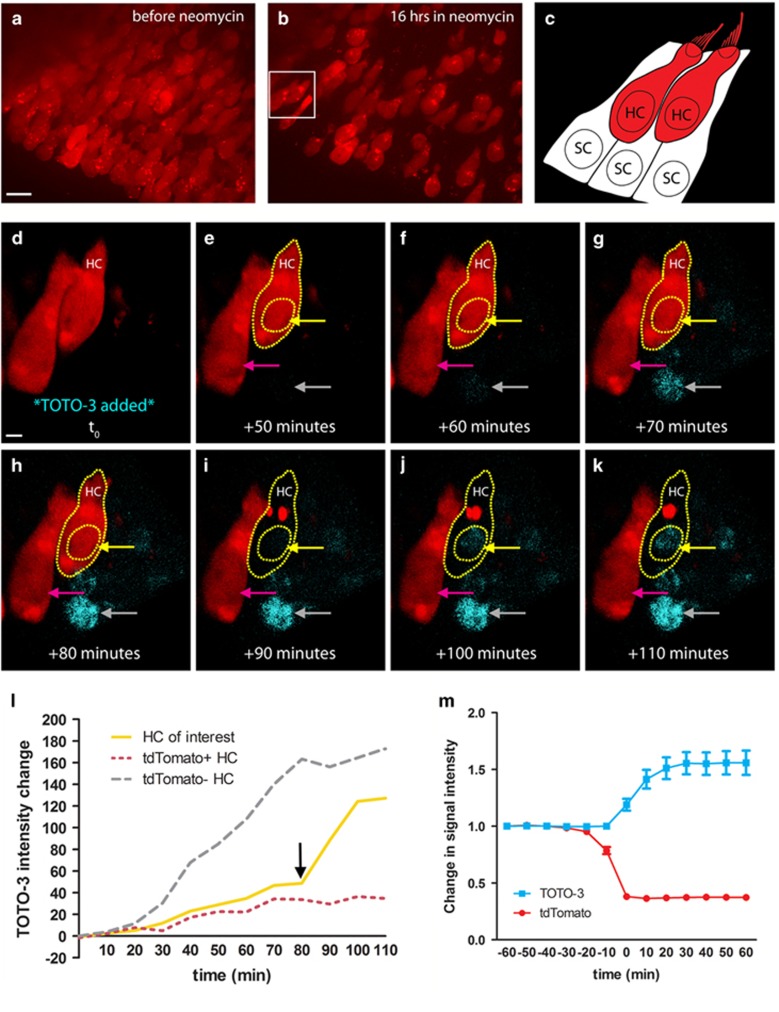
Loss of tdTomato signals HC death. (a) HCs (red) at the onset of live imaging before the addition of neomycin. Maximum intensity projection (MIP), scale bar=10 μm. (b) Culture in neomycin for 16 h results in death of many HCs. Box indicates the HCs that are shown at higher magnification in d–k. (c) Schematic of the boxed region from b. Two HCs are visible in the center of the field. SCs completely surround each HC in the utricle, but are not expressing any fluorophore and are therefore not visible in the image series. (d–k) TOTO-3 was added to cultures as a dead cell indicator, following 19 h of imaging in neomycin (t0). Gray arrow indicates a TOTO-3-positive HC nucleus that lost membrane integrity before the addition of TOTO-3. Scale bar=2 μm. (h and i) The HC outlined in yellow (HC) loses tdTomato signal between +80 and +90 min. (i and j) The TOTO-3 signal in this nucleus increases over the next 20 min of imaging, becoming strongly visible. The nucleus from the tdTomato-positive HC that does not die in this image series does not show an increase in TOTO-3 (magenta arrow). (l) The mean TOTO-3 fluorescent intensity of each indicated nucleus (above) was quantified and its change over time was plotted. The black arrow marks the last tdTomato-positive time point of the HC of interest. (m) In a separate set of experiments, TOTO-3 signal intensity was quantified for 60 min before and after HC death (loss of tdTomato) in neomycin. On average, cells became tdTomato-negative and TOTO-3-positive in the same 10-min imaging interval. Movie available as Supplementary Figure 1. N=26–28 HCs across 6 image fields from 2 utricles per time point; values represent mean±S.E.M.

