Figure 6.
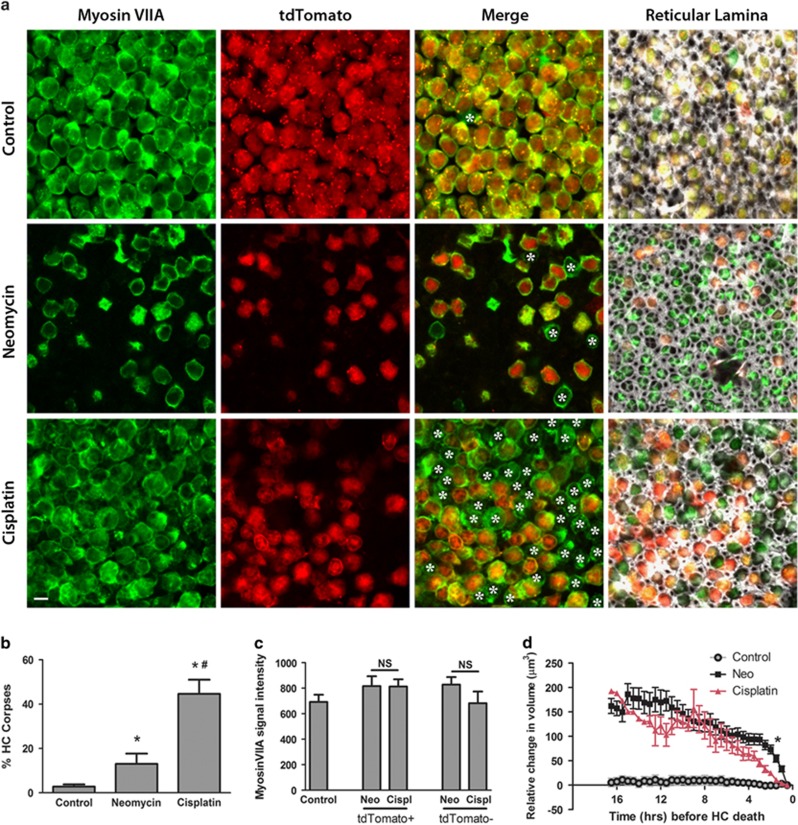
HC corpses accumulate in cisplatin-treated utricles. (a) Utricles were cultured in either control medium (upper row), neomycin (middle row), or cisplatin (bottom row) until 50% of the HCs died (or a matched time point in control medium). Four hours later, utricles were fixed and stained for the HC marker myosin VIIA (green), which was compared with the tdTomato signal present in living HCs (red). HC corpses (cells that are myosin VIIA-positive and tdTomato-negative) are indicated by asterisks in merged images from each condition. All images were acquired at the plane of the HC nuclei, with the exception of those in the fourth column, which were taken at the level of the reticular lamina and include the f-actin signal (white) in the merged image. Scale bar=5 μm. (b) The percentage of HC corpses was significantly increased in neomycin-treated utricles over controls, while the percentage of HC corpses was highest in the cisplatin-treated utricles. Bars represent mean±S.E.M. N=358–2583 HCs across 3–4 utricles per condition. *P<0.05 versus control, #P<0.05 versus neomycin. (c) Myosin VIIA signal intensity was not reduced in neomycin-treated tissue relative to cisplatin-treated tissue. Both tdTomato+ and tdTomato− HCs were analyzed at the nuclear plane. Bars represent mean±S.E.M. N=7 HCs per condition. (d) HC volume was analyzed over time in control, neomycin, and cisplatin-treated tissue. As the HCs cultured in either neomycin or cisplatin approached HC death (indicated by loss of tdTomato signal at t=0 h), HCs from both conditions shrank in volume, particularly in the last 3–4 h before death. HCs cultured in control medium were tracked for the same amount of time as the drug-treated utricles, but they did not die and did not shrink in volume. N=1–31 HCs per time point, values represent mean±S.E.M. *P<0.0002 via t-test with Bonferroni correction, neomycin versus cisplatin

