Figure 2.
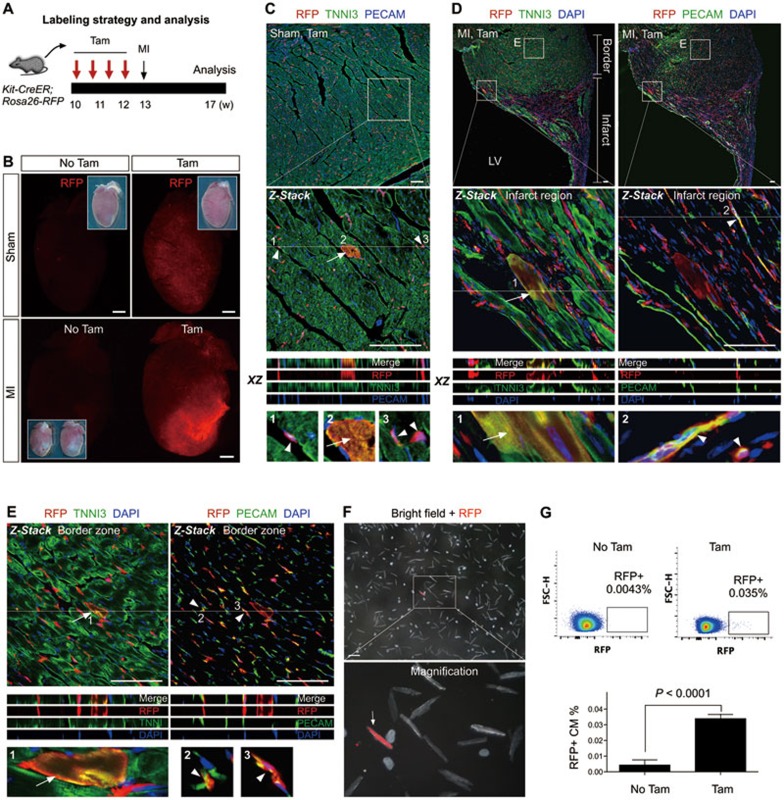
The fate of Kit+ cells after MI. (A) A schematic of tamoxifen induction, MI and analysis. (B) Whole mount fluorescence view of sham or MI hearts with or without tamoxifen treatment (Tam or No Tam). Inserts are the same hearts in bright field. (C) Immunostaining for RFP, TNNI3 and PECAM on Kit-CreER;Rosa26-RFP heart sections (Sham, Tam). Kit-CreER labels cardiomyocytes (RFP+TNNI3+, arrow) or endothelial cells (RFP+PECAM+, arrowheads). (D, E) Immunostaining for RFP, TNNI3 and PECAM on heart sections after MI. Kit-CreER labels cardiomyocytes (RFP+TNNI3+, arrow) or endothelial cells (RFP+PECAM+, arrowheads) in both infarcted (D) and border regions (E). Z-stack images were taken for all magnified regions. XZ scanned images are shown by merge and split channels. 1, 2, 3 are magnified images of cells indicated by arrows or arrowheads. (F) Images of cells dissociated from MI hearts of Kit-CreER;Rosa26-RFP mice. Arrow indicates a rare RFP+ cardiomyocyte. (G) Quantification of the percentage of RFP+ cardiomyocytes in MI hearts by flow cytometry. n = 4. Scale bars, 1 mm in B; 100 μm in C-F.

