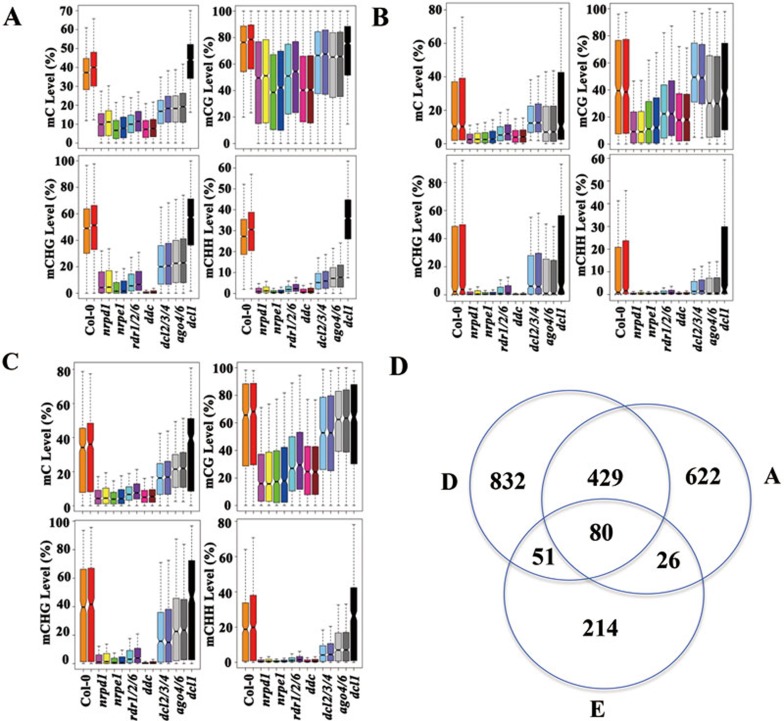
Figure 2.
Profiles of DNA methylation. Boxplots showing the distribution of average DNA methylation levels at (A) hypo-mC-DMRs in nrpd1 (Supplementary information, Table S2), (B) D loci (DCL2/3/4-independent loci), and (C) A loci (AGO4/6-independent loci) (Supplementary information, Table S2). (D) Venn diagram showing the common regions among D loci, A loci and E loci (NRPE1-independent loci; Supplementary information, Table S2). Overlapped regions between D, A, E loci are defined as regions that are overlapped by at least 20% in length (of the shorter DMR), while non-overlapped regions do not physically overlap. Please note that the number discrepancy between DMR number in Supplementary information, Table S2 and the sum of numbers in the venn circles comes from regions that are overlapped by < 20% in length.

