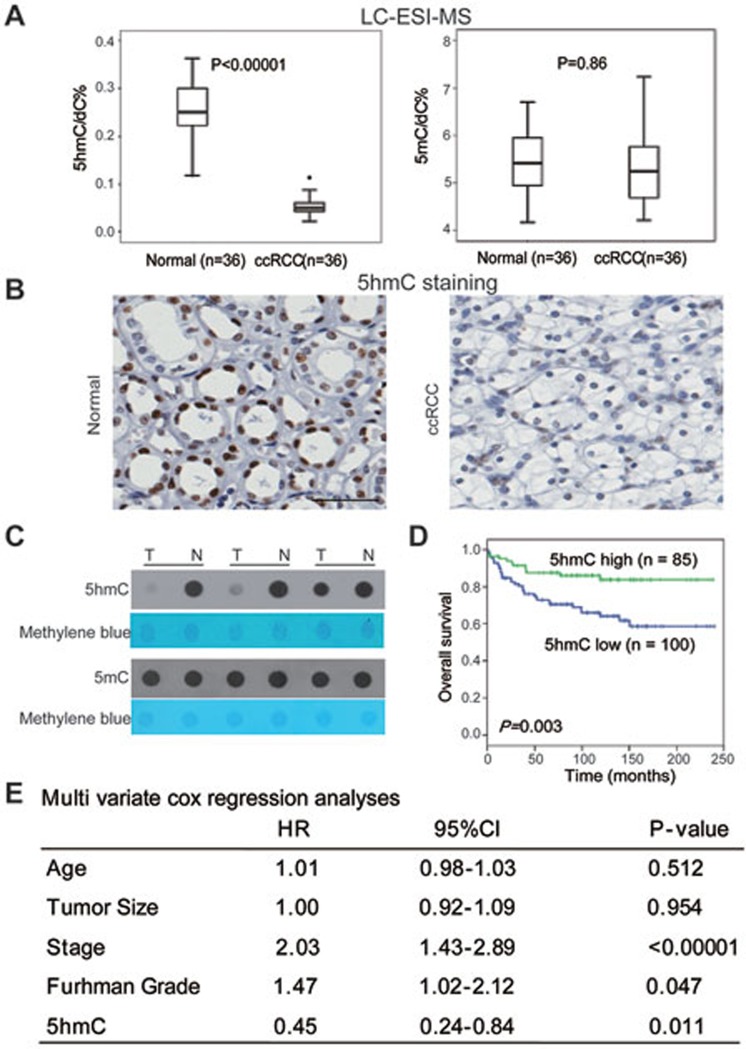
Figure 1.
Loss of 5hmC but not 5mC is a hallmark of ccRCC. (A) 5hmC and 5mC levels were evaluated by the LC-ESI-MS method. P-values were calculated by the two-tailed student's t-test. (B) IHC staining of 5hmC in paired tumor and normal samples of one representative ccRCC patient. Scare bar, 100 μm. (C) Dot blot assays of 5hmC and 5mC. Three representative paired samples are shown. T, tumor; N, matched normal tissue. (D) Kaplan-Meier survival curves of ccRCC patients in the TMA. “5hmC high” and “5hmC low” represent cases in which > 10% and ≤ 10% cells are positive for IHC staining of 5hmC, respectively. P values were calculated by the log-rank test. n, the number of cases. (E) Multivariate Cox regression analyses of ccRCC cases in the TMA.

