Figure 3.
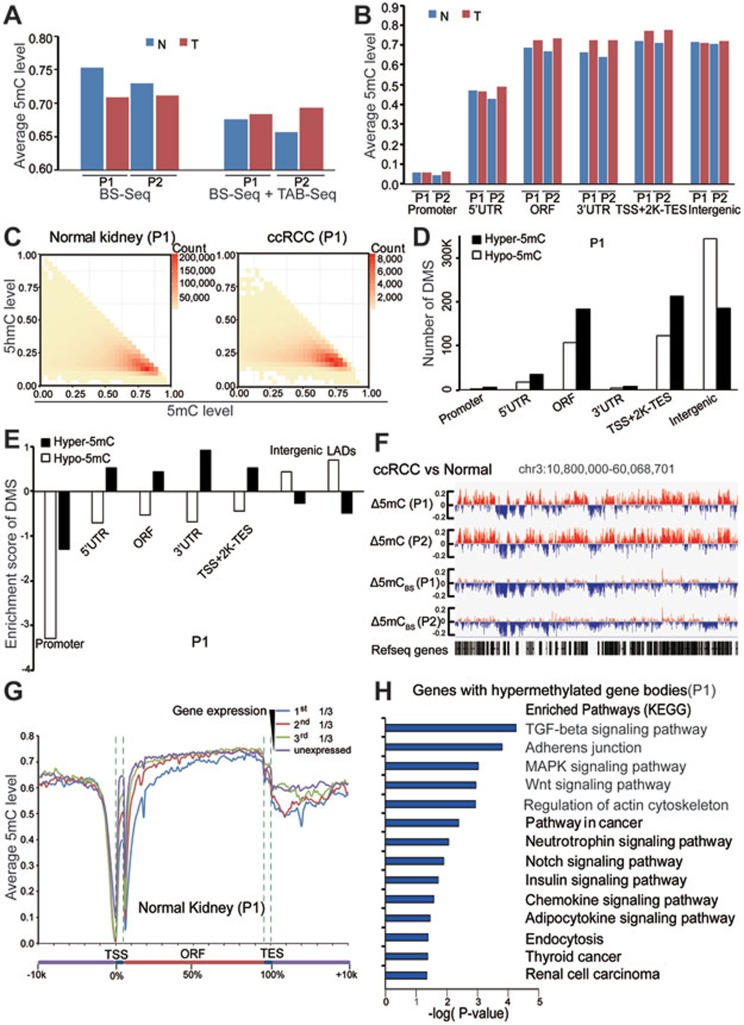
Genome-wide single-nucleotide resolution mapping of 5mC. (A) Global changes of average 5mC levels in tumors and matched normal tissues. 5mC was calculated as the rate from BS-Seq (5hmC + 5mC) minus the 5hmC rate measured from TAB-seq. (B) Global changes of average 5mC levels in different genomic elements. (C) Heatmap of 5mC level at 5hmC sites in tumor and matched normal tissues. The scale bar from yellow to red represents the number of 5mC/5hmC modified sites from low to high. X and y axis showed the 5mC and 5hmC level of those modified sites, respectively. (D) The numbers of DMS in different genetic elements (promoter is defined as ± 500 bp of TSS). (E) The enrichment scores of DMS in different regulatory elements. LADs represent nuclear lamina-associated domains identified in TIG3 fibroblast cells. (F) Graphical representation of 5mC pattern in a region of chromosome 3. 5mCBS represents the methylation level from BS-seq only. (G) The average 5mC level throughout different gene-associated regions in normal kidney tissue from patient 1. Genes in the analyzed sample were divided into four groups according to their expression levels (FPKM value). (H) The KEGG pathway analyses of genes that gain methylation in gene body regions during tumorigenesis. The significance was illustrated by P-value. T and N represent tumor and matched normal tissue, respectively. P1 and P2 represent patients 1 and 2, respectively.

