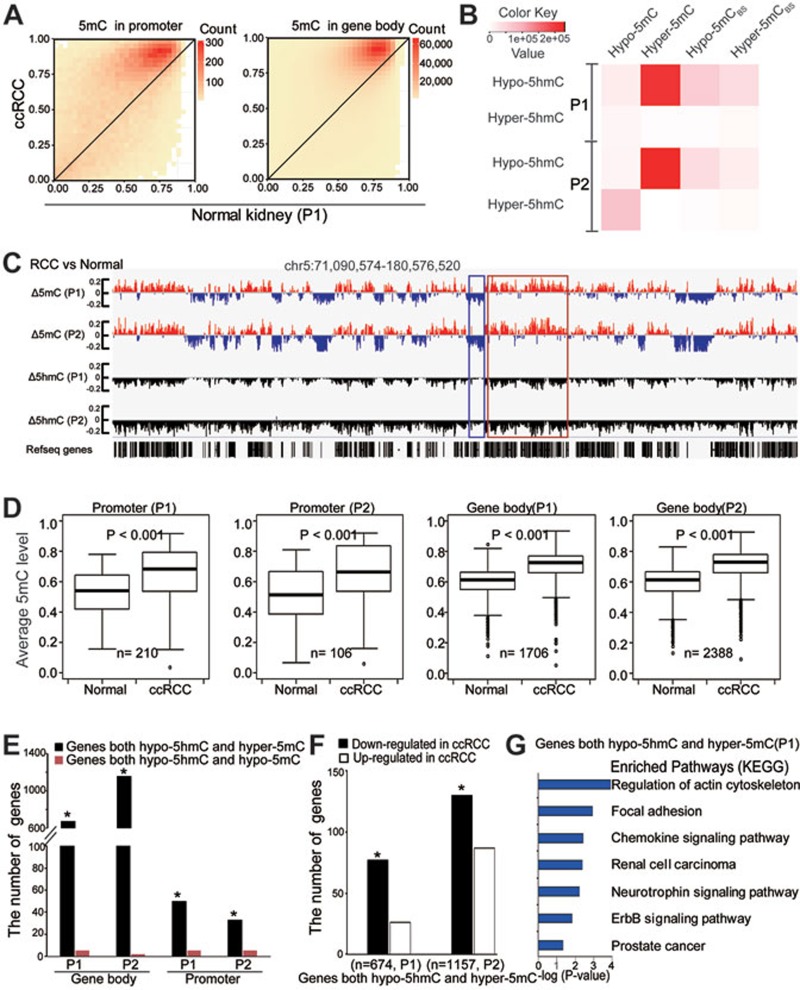
Figure 4.
Loss of 5hmC is linked to gene body hypermethylation in tumor tissues. (A) Heatmap of the estimated abundance of 5mC in tumor and matched normal tissues at 5hmC sites called in promoter or gene body regions. The scale bar from yellow to red represents the number of 5hmC sites from low to high. (B) Heatmap for the number of overlapped sites between DhMS and DMS. Hyper-5mCBS and Hypo-5mCBS sites were calculated by BS-seq data only. The color key from white to red represents the number of sites from low to high. (C) Wiggle tracks of a region from chromosome 5. Δ means the difference of 5mC or 5hmC level between ccRCC and normal samples. (D) Box-plot of average 5mC levels of the genes with hypo-5hmC promoters or gene bodies in tumor compared with those in normal tissues. (E) The number of overlapped genes among genes with hypo-5hmC, hyper-5mC and hypo-5mC promoter or gene body regions. The significance of the overlaps was tested using GeneOverlap (Fisher's exact test-based method; *P < 0.001). (F) The bar plots showing numbers of genes that harbor hypo-5hmC and hyper-5mC gene bodies and display changes in expression levels in ccRCC. n represents the number of genes with both hypo-5hmC and hyper-5mC signatures in gene bodies. *P < 0.001. (G) The KEGG pathway analyses of genes with both hypo-5hmC and hyper-5mC signatures in gene bodies. The significance was illustrated by P value. P1 and P2 represent patients 1 and 2, respectively.

