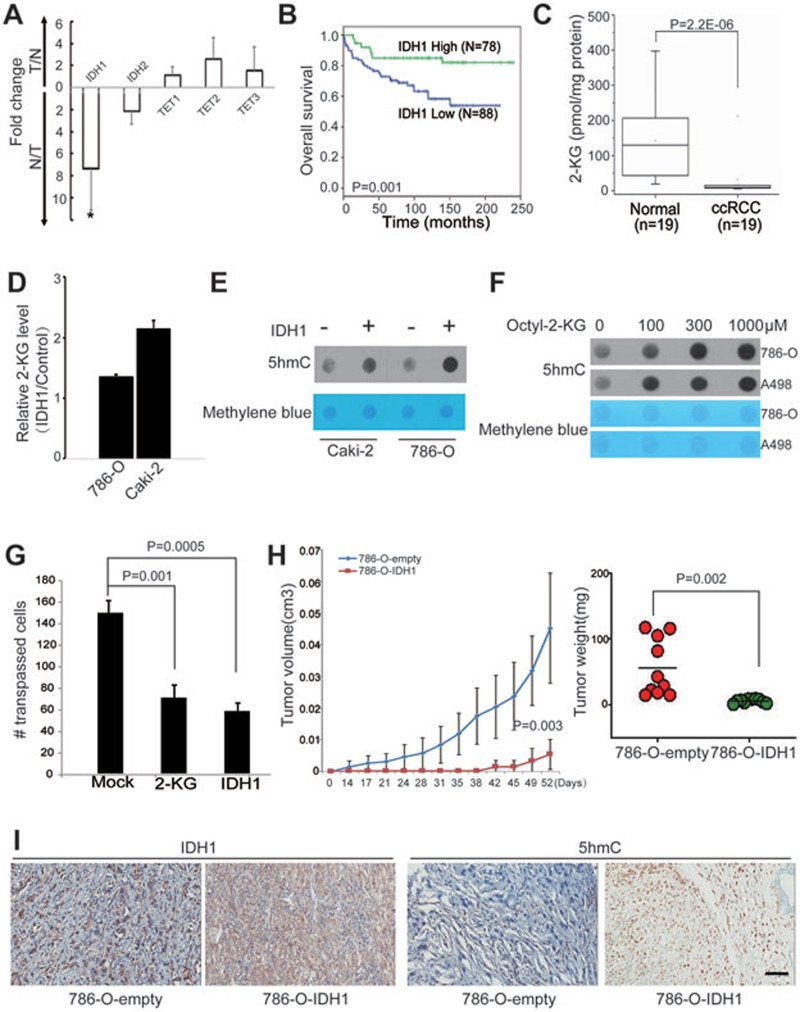
Figure 5.
IDH1 downregulation leads to loss of 5hmC, and restoring 5hmC levels attenuates tumor growth. (A) The relative expression levels of the indicated genes in ccRCC patient samples were measured by RT-qPCR. Data are shown as the mean ± SD (n = 6). P-values were calculated by the Wilcoxon test (*P = 0.002). (B) Kaplan–Meier survival curves of ccRCC patients in the TMA. “IDH1 high” and “IDH1 low” represent that > 10% and ≤ 10% cells are stained, respectively. P value was calculated by the log-rank test. (C) The 2-KG levels in ccRCC patient tissues were evaluated by the LC-ESI-MS method. P values were calculated by the Wilcoxon test (P = 2.2E−06). (D) The intracellular 2-KG level in ccRCC cell lines was measured by the LC-ESI-MS method. Y axis represents the intracellular 2-KG level in IDH1-transfected cells relative to that in control cells. (E) Dot blot assay of 5hmC levels in ccRCC cell lines with transient transfection of IDH1 or empty vector. Equal loading was validated by methylene blue staining. (F) 786-O and A498 ccRCC cells were treated with cell-permeable octyl-2-KG for 48 h. The 5hmC levels were measured by dot blot assay. (G) Cell invasion capacity was evaluated by transwell assay. 786-O ccRCC cells were treated with octyl-2-KG (300 μM) or transiently overexpressed IDH1 for 48 h. (H) Tumor growth curves of xenografts with 786-O-IDH1 or 786-O-empty vector cells. Tumor volume is shown as the mean ± SD (n = 10 mice). Tumor weights of the indicated xenografts at endpoint (52 days) are shown as the mean± SD (n = 10 mice). P-value was calculated by a two-tailed student's t-test. (I) A representative IHC staining of IDH1 and 5hmC in the indicated xenograft. Scare bar, 100 μm.

