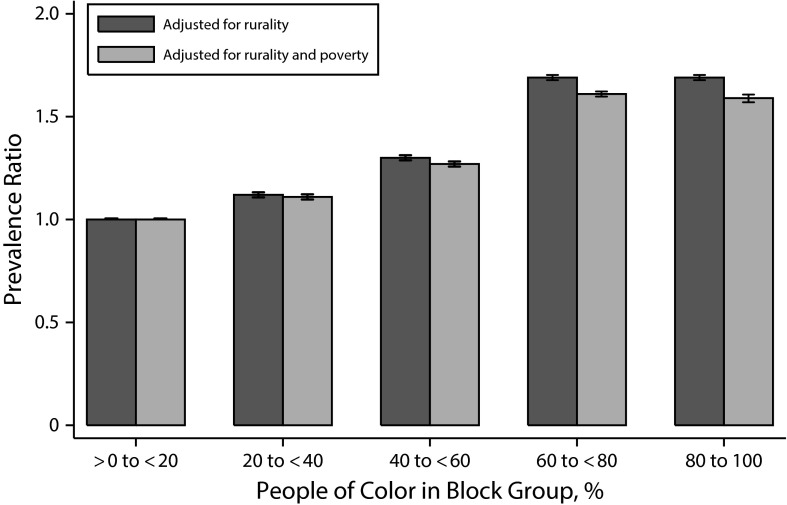
FIGURE 3—
Prevalence Ratios Comparing the Percentage of People Living Near a Disposal Well in Census Block Groups With ≥ 20% People of Color vs Those With < 20% People of Color, Adjusted for Rurality and Rurality With Poverty: Eagle Ford Shale Region, TX, 2007–2014
Note. Dichotomized into high and low poverty on the basis of the mean census block group level. Error bars depict 95% confidence intervals.

