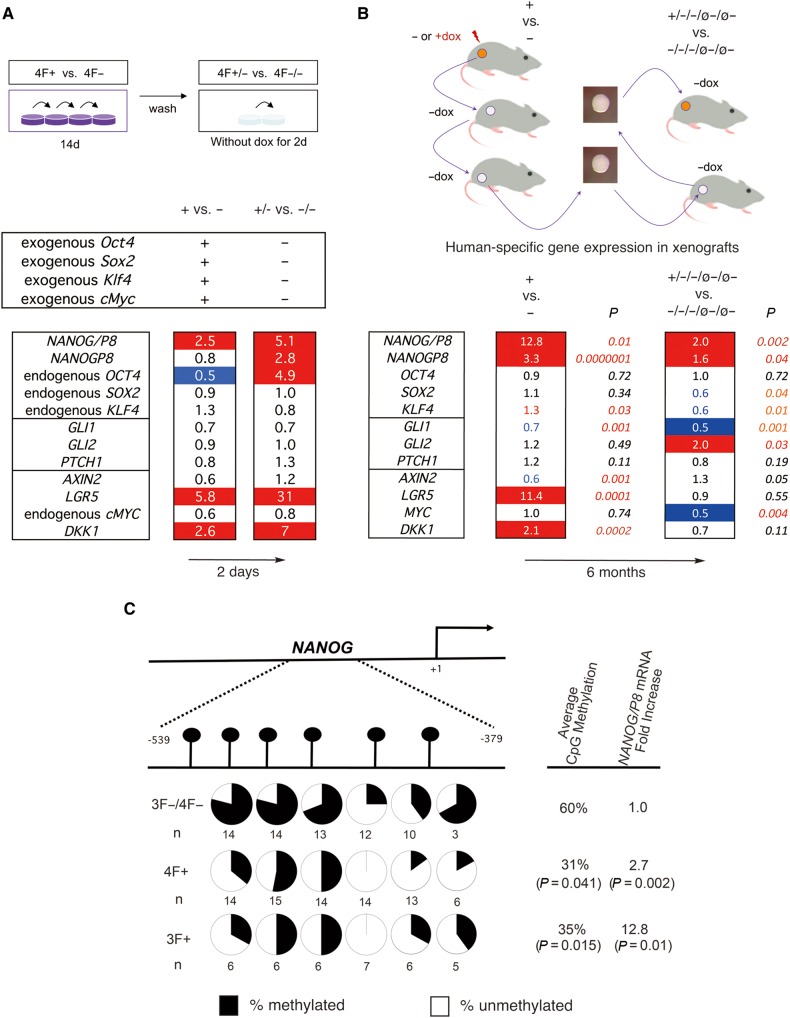
Figure 5.
Selected gene expression changes induced by metastatic reprogramming and demethylation of NANOG. (A) In vitro gene expression changes. Top: Diagram of the strategy for in vitro reprogramming for 14 days followed by 2-day culture without dox. Bottom: Heat map of endogenous human gene expression changes after normalization shown as fold change (ratios over controls as indicated, e.g. + vs. −). Endogenous genes were detected with 5′UTR primers (as in B). Exogenous OSKM genes were tested with specific primers and found to be expressed only during dox treatment. (B) In vivo gene expression changes. Top: Diagram of the strategy used to derive the material used for gene expression analyses in vivo. Bottom: Heat map of fold change in experimental over control samples as indicated. All genes noted are endogenous genes of engrafted human tumor cells. Numbers are the geometrical mean of normalized individual fold changes. The number of individual tumors analyzed for each case were n = 10 for 3F+, n = 10 for 3F−, n = 10 for 3F+/−/−/ø−/ø−, and n = 8 for 3F−/−/−/ø−/ø−. P-values were derived from t-tests using the normalized Ct values without outliers outside the +/−2SD space. The heat maps of A and B show increased (1.5-fold or more) expression highlighted in red and decreased (0.5 or less) expression in blue. Numbers in red or blue in B bottom denote significative up (red) or down (blue) changes within the <0.5-to-<1.5-fold interval. (C) Reprogramming factors induce DNA methylation changes in NANOG. The upper diagram shows the position of analyzed CpG dinucleotides in the 5′ promoter region of NANOG and their methylation status (represented in pie charts in the lower part of the diagram) as determined by bisulfite sequencing. All uninduced controls were pooled as there were no differences between 4F− vs. 3F− samples. P-values are for experimental vs. control samples as indicated using t-tests. The overall CpG methylation of all the samples tested is noted, as is the average fold change in NANOG/P8 expression in the same samples. See Supplementary Figures S4−S6 for OCT4 data and MSPs.

