Figure 7.
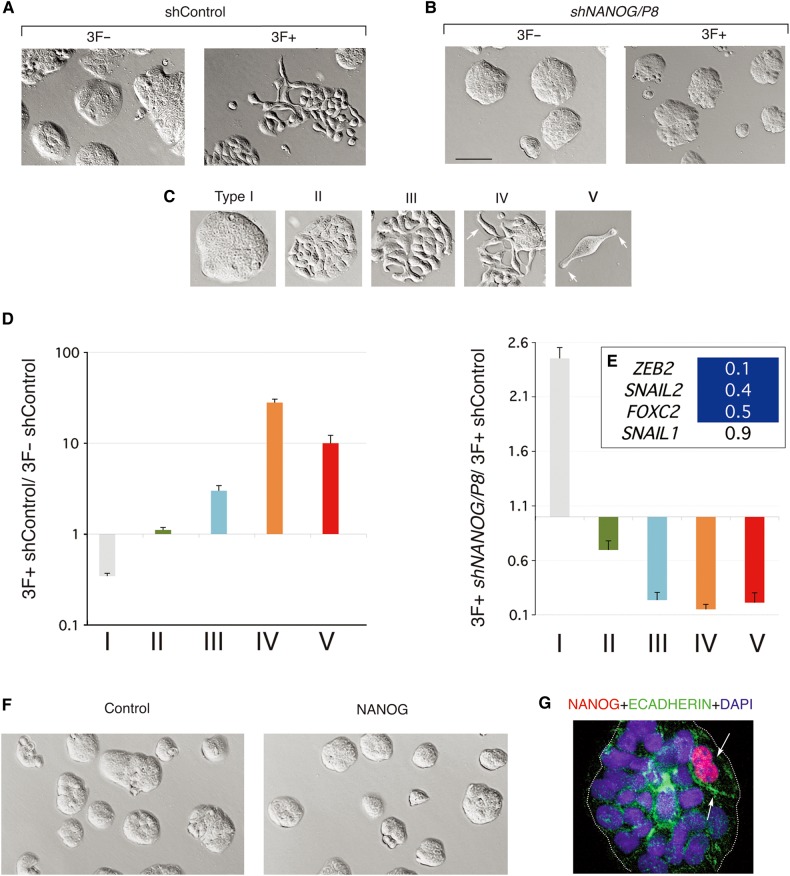
NANOG function is required but not sufficient to induce reprogrammed EMT-like phenotypes. (A and B) Images of in vitro CC14 colon cancer cultures control and reprogrammed cells showing diverse phenotypes with normal (A) or compromised (B) NANOG function. Nomarksi images of 3F+ or 3F− cells with control or shNANOG lentivectors after 14 days of dox treatment show the typical growth of CC14 epithelial islands under control conditions without dox and the appearance of EMT-like cell phenotypes after dox treatment (shControl; 3F+). (C and D) Classification and quantification of resulting phenotypes after dox induction and reprogramming as described in the text. Arrows in C point to cell extensions (in type IV, V). The histograms in D show phenotypes that appear during reprogramming in control 3F cells after dox addition (3F+ control vs. 3F− control) but not in 3F+ shNANOG cells as compared with 3F+ control cells (3F+ shNANOG vs. 3F+ control). Error bars are SEM. (E) Heat map of the expression of selected genes as shown after normalization with housekeeping genes. Blue cells denote decreased values as compared with control as noted. (F) Images of control (cells transduced with a control lentivector) and NANOG-expressing cells (cells transduced with a lentivector expressing NANOG) show similar morphologies 18 days after infection. (G) Double immunofluorescence of an epithelial CC14 island, which contains two cells expressing high levels of exogenous NANOG (red) and endogenous ECADHERIN (green). Nuclei are counterstained with DAPI (blue). Scale bar, 140 µm (A, B, F), 70 µm (C types I−IV), 30 µm (C type V), 25 µm (G).

