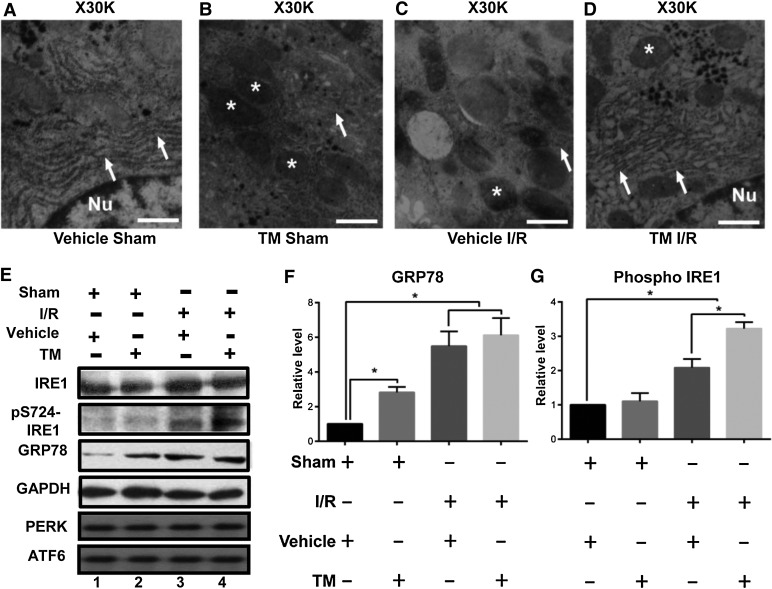
Figure 2.
ER stress preconditioning attenuates hepatic ultra-structural damage and elicits IRE1 activation and GRP78 upregulation. (A–D) Representative TEM images of liver specimens from different dosing groups show subcellular, ultra-structural changes in hepatocytes. Mitochondria are indicated with asterisks, and ER are indicated with arrows. Scale bar, 0.5 µm. (E) Representative western blots of IRE1, phosphorylated IRE1 (pS724-IRE1), GRP78, GAPDH, PERK, and ATF6 in liver samples from different dosing groups. (F and G) Quantification of E from three independent experiments. Data are expressed as mean ± SEM. *P < 0.05.

