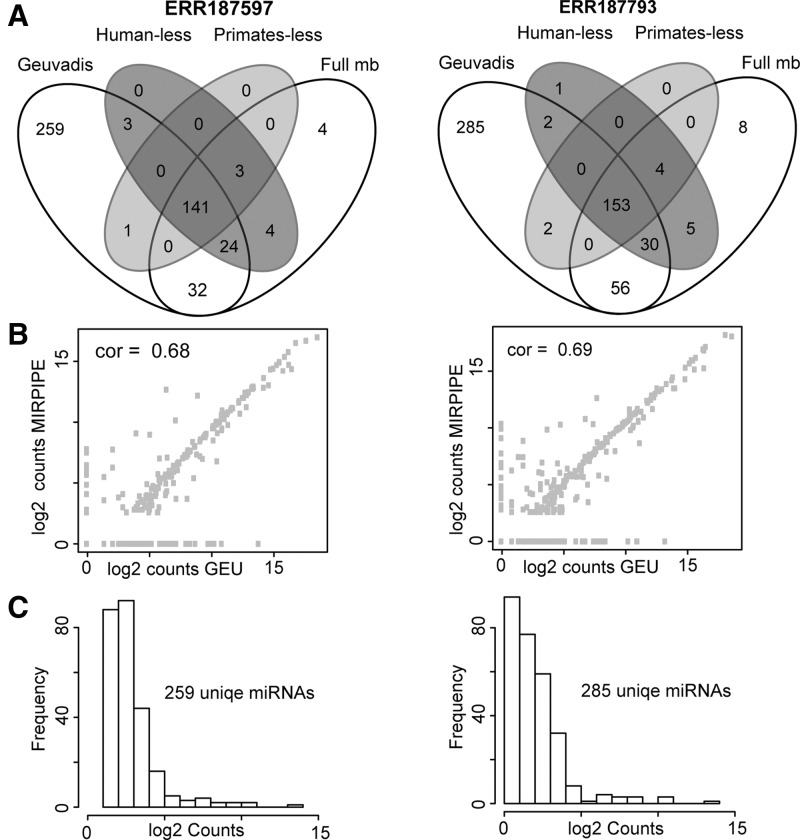
Fig. 1.
A) Comparison of MIRPIPE prediction on two gold standard (GS) datasets using full miRBase and reduced miRBase as reference set. (B) Spearman correlation of absolute counts of GS and MIRPIPE. (C) The large number of GS-specific miRNA identifications is caused by low counts, filtered out by MIRPIPE default parameters

