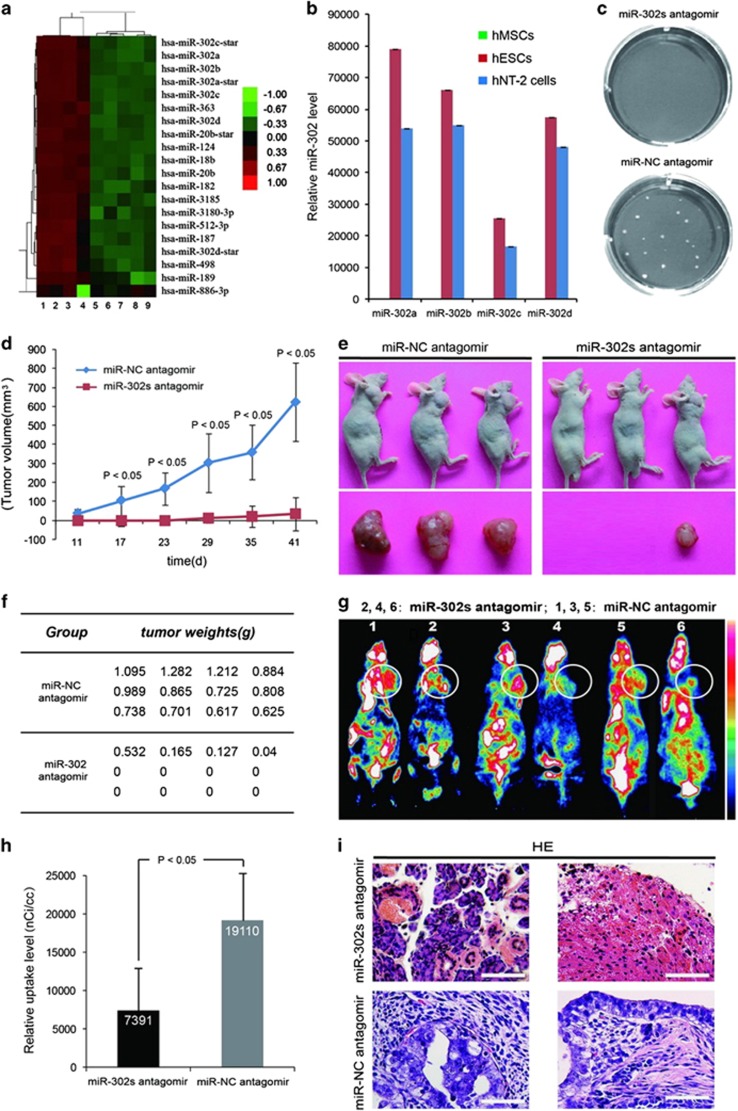
Figure 1.
miR-302 downregulation inhibits the tumorigenicity of hPSCs in vitro and in vivo. (a) miRNA microarray analysis of the miRNA expression profile of hESCs, hMSCs, fibroblasts and embryoid bodies. 1–2: H9, 3: chHES-22, 4–6: hMSCs, 7: BJ fibroblast, 8: D2, 9: 15-day embryoid body. Expression values are represented in shades of red and green relative to being above (red) or below (green) the median expression value across all samples (log scale 2, from −3 to +3). (b) miR-302a, miR-302b, miR-302c and miR-302d expression are detected by miRNA-specific qRT-PCR assays (n=3). U6 was used as an internal normalization control, and data were normalized to the level of hMSCs. (c) Soft agar colony formation assay was performed using hNT-2 cells after transfection with miR-302s antagomir for 21 days. miR-NC antagomir-transfected hNT-2 cells was used as control. (d) miR-302s-suppressed hNT-2 cells were delivered into 6-week-old male athymic mice (BALB/c nu/nu strain) (n=12). The volume of tumors was calculated and plotted and tumor growth curves were obtained. Negative control-transfected hNT-2 cells were used as control. (e) Representative image shows tumor formation when hNT-2 cells were delivered into mice (BALB/c nu/nu strain). (f) The weights of the tumors were measured at the end of time. (g) Xenografts were scanned by small-animal PET. The numbers 2, 4, 6 indicate the miR-302s-suppressed hNT-2 cells group, and 1, 3, 5 indicate the negative control-transfected hNT-2 cells group. White circles showed the location of xenografts in the mice. Fifty minutes after FDG injection, mice were anesthetized by inhalation of 2% isoflurane in oxygen using Summit AS-1-000-7 animal isoflurane anesthesia equipment before microPET static data acquisition with continuous inhalation of isoflurane through an animal mask, and kept at 37 °C until imaging. White and black are relative to being above (white) or below (black) the uptake median expression value across all samples. (h) Tissue uptake value was expressed as radioactive count per milliliter (nCi/cc). Interscapular BAT maximum uptake values and xenograft mean uptake values are measured from sagittal images and coronal images respectively (n=6). The data are presented as the mean±S.D. (i) Histological analysis of xenografts was shown by hematoxylin and eosin staining. Scale bars, 100 μm. P-values were obtained using Student's t-test

