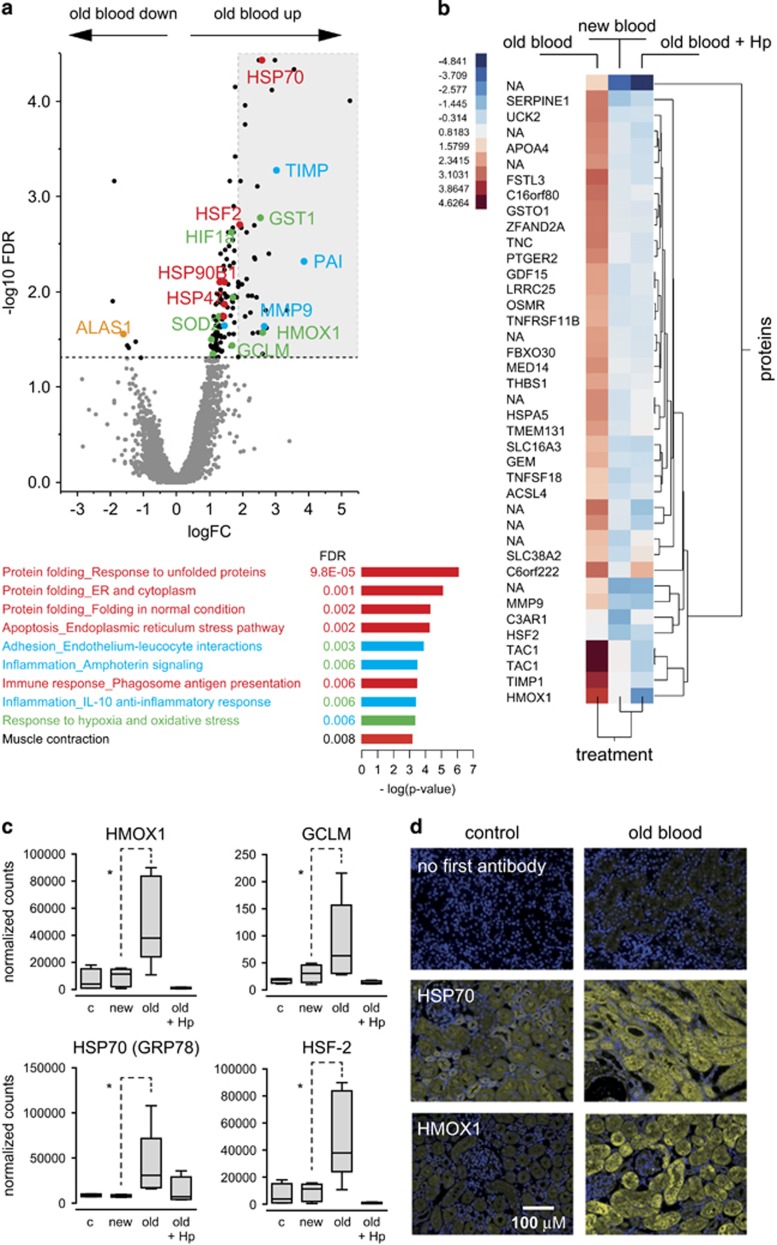
Figure 2.
Hemolysis triggered renal gene expression. (a) Volcano plot of all gene expression tags that were found by serial analysis of gene expression (SAGE) of guinea pig renal tissues. LogFC indicates the relative gene expression in renal cortical tissues of old blood-transfused versus new blood-transfused animals. The threshold of significance was set at a false discovery ratio (FDR)<0.05. Selected transcripts are labeled and color-coded for related functions: red—protein folding/response to unfolded proteins; green—response to oxidative stress; blue—inflammation. The significant results of a MetaCore analysis for the enrichment of functional networks among significantly upregulated genes are shown at the bottom. The light-gray area in the volcano plot highlights the top 40 upregulated genes that were re-analyzed in the hierarchical clustering analysis shown in (b). The color-coded gene expression indicates the ratio of normalized SAGE-tagged counts of treated versus untreated control tissues (upregulated genes are red). (c) Box plots of SAGE mRNA transcript counts for selected genes (*P<0.05). (c) Sample box plots of normalized sequence counts. *p<0.05. (d) Immunofluorescence analysis of heat shock protein 70 (Hsp70) and heme oxygenase-1 (HMOX1) in renal tissues of control and old blood-transfused animals. Control slices were stained with goat anti-rabbit (Alexa 568) secondary antibody without any primary antibody. Images were acquired with a Zeiss Axioskop 2 epifluorescence microscope at an original magnification of × 200

