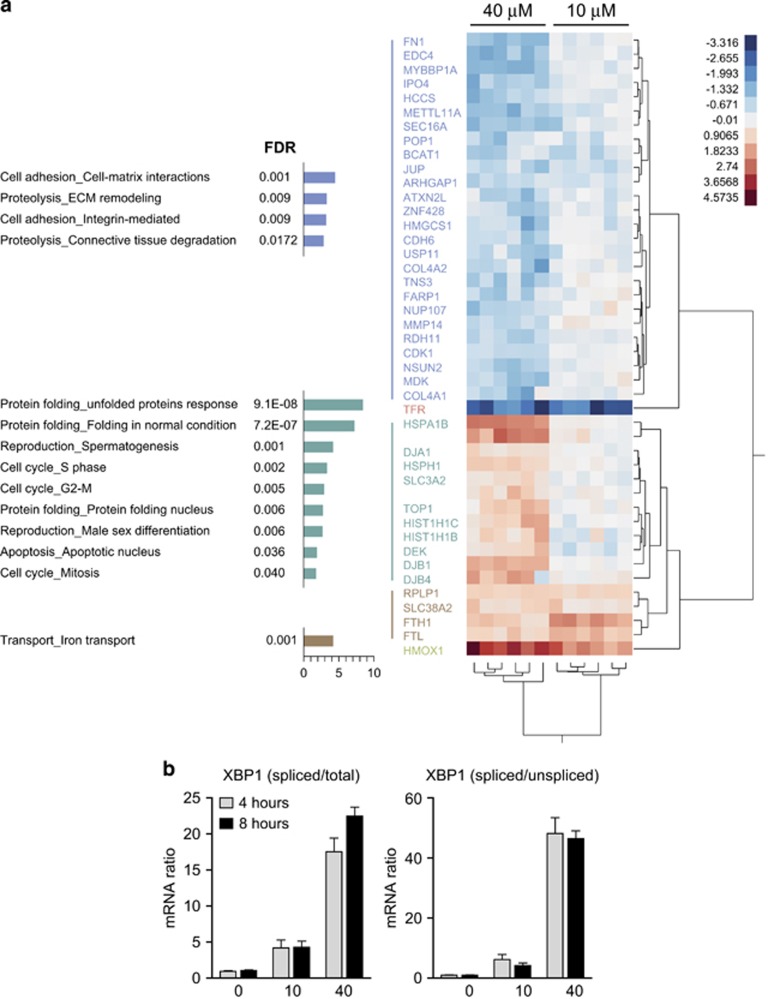
Figure 6.
Free heme-triggered gene expression in renal epithelial HK-2 cells. (a) Hierarchical clustering analysis of all HK-2 proteins that were up (red) or down (blue) regulated by 10 or 40 μM heme compared with control cells. Only proteins that were detected in all six samples per condition were included in this analysis. Three protein clusters were identified. The brown cluster was upregulated by both heme exposures, the green cluster was only upregulated at 40 μM heme, and the blue cluster was downregulated by 40 μM heme. In addition, the analysis identified the upregulation of HMOX1 and the suppression of the transferrin receptor (TFR) in all heme-treated samples. Significant results of a MetaCore analysis for the enrichment of functional process networks in the three different protein clusters are shown on the left. (b) X-box binding protein 1 (XBP1) splicing in heme-exposed (8 h) HK-2 cells was measured as a marker for the unfolded protein response

