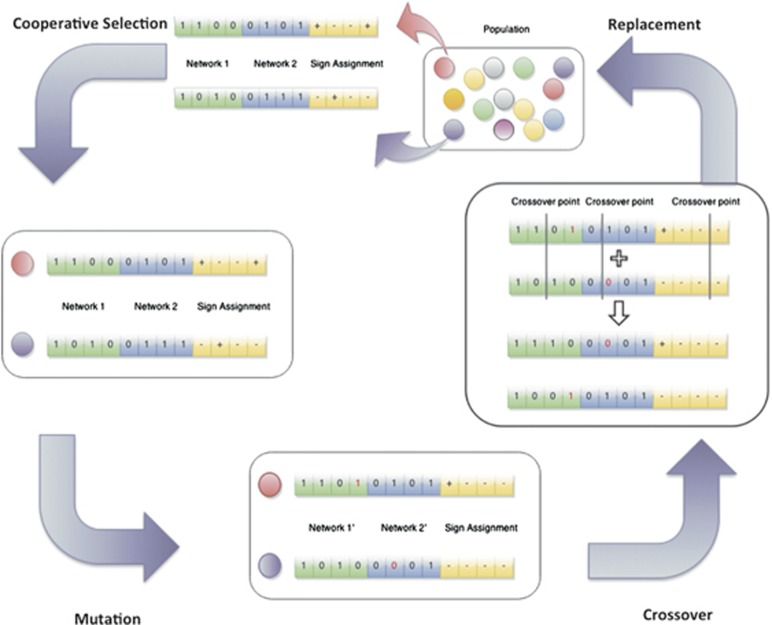
Figure 4.
Workflow of the GA. Starting from a randomly generated population of binary representations of two phenotype-specific networks and the mode of action corresponding to the contained interactions, the GA iteratively selects two individuals, mutates them – that is, prunes or restores some of their interactions – and recombines them. Each individual contains interaction information of the control network (green), the disease network (blue) and a mode of action assignment (yellow). The mode of action is either activation (+) or repression (−). Finally, the two newly derived individuals replace the worst individuals in the population. Based on simulation assays, the agreement between network attractors and transcriptomic data is assessed for each individual. A score is derived in taking into account network attractors and stability

