Figure 3.
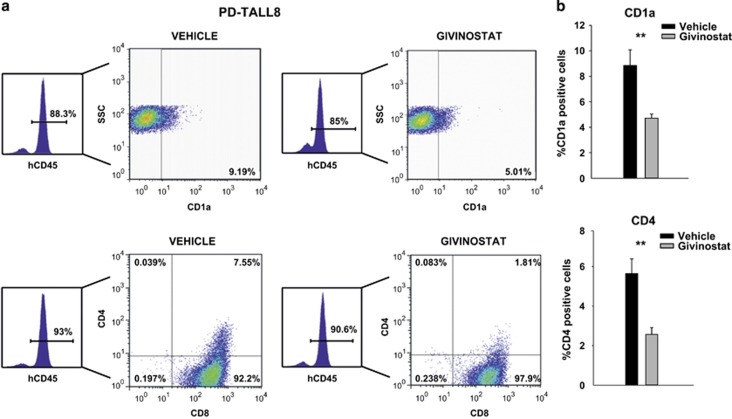
Givinostat induced differentiation of a TLX1-driven xenograft. (a) Flow cytometry analysis of CD1a (top) and CD4/CD8 (bottom) expression in human CD45-positive spleen cells isolated from PD-TALL8 leukemia recipient mice treated with Givinostat or vehicle (n=8/9 mice/group) for 5 days. A representative flow cytometry plot is shown. (b) Histograms report the mean values±S.D. of CD1a (top) and CD4 (bottom) in all mice analyzed. Data were analyzed with Mann–Whitney test with Bonferroni correction (**P<0.01)

