Figure 7.
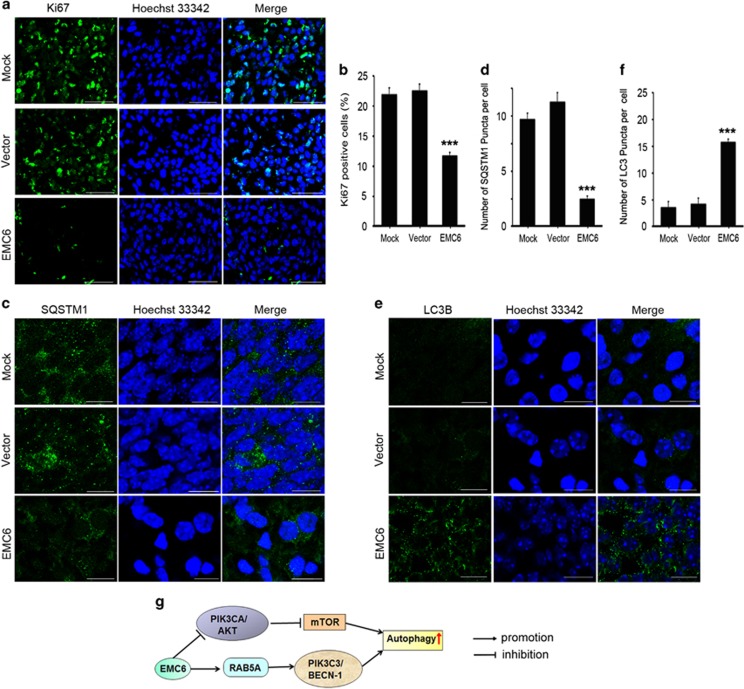
Overexpression of EMC6 inhibits cell proliferation, increases autophagy in GBM. (a) The brain frozen sections were obtained from the indicated groups of mice and performed by immunofluorescence assay. Representative confocal microscopy images of the fluorescence of Ki67 were analyzed. Nuclei were stained with Hoechst 33342. Scale bar, 50 μm. (b) Five randomly selected areas from each slide were examined for the percentage of Ki67-positive cells in total cells under fluorescence microscope. All experiments were performed in triplicate. Data are means±S.D., ***P<0.001. (c) The treatment of frozen sections is same as (a). Representative confocal microscopy images of the SQSTM1 distribution were analyzed. Scale bar, 10 μm (d) Five randomly selected areas from each slide were examined for the number of SQSTM1 puncta per cell under fluorescence microscope. All experiments were performed in triplicate. Data are means±S.D., ***P<0.001. (e) The treatment of frozen sections is same as (a) Representative confocal microscopy images of the distribution of LC3B were analyzed. Scale bar, 10 μm (f) Five randomly selected areas from each slide were examined for the number of LC3 puncta per cell under fluorescence microscope. All experiments were performed in triplicate. Data are means±S.D., ***P<0.001. (g) A schematic model of EMC6-regulating autophagy

