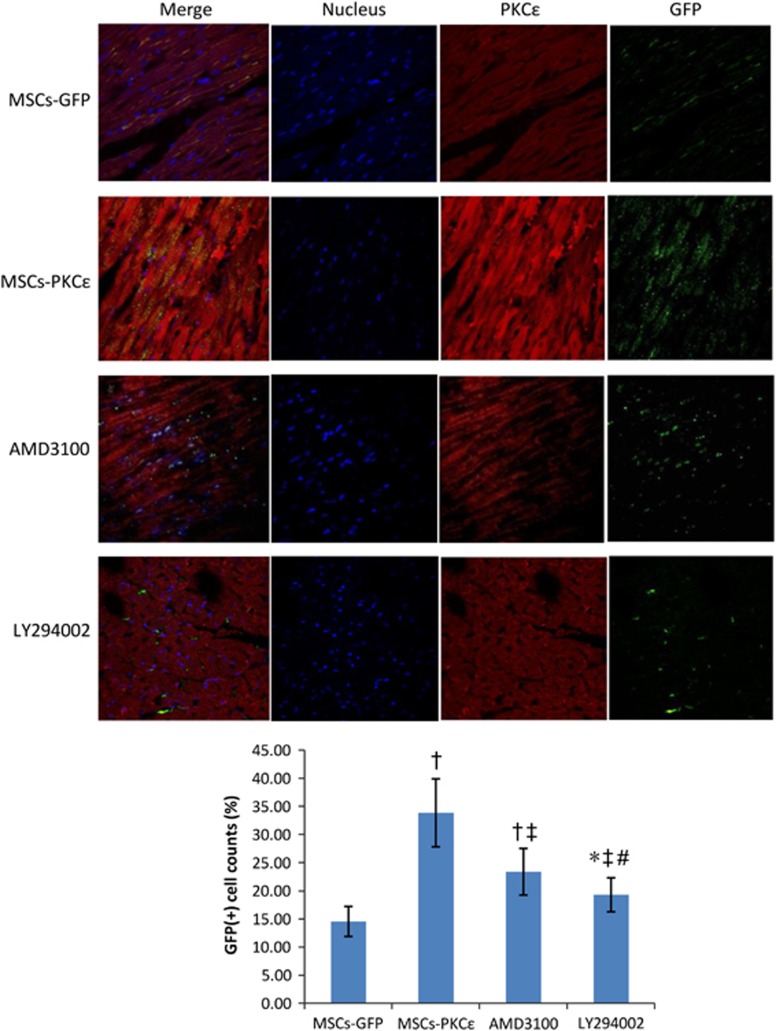
Figure 2.
Retention and distribution of transplanted MSCs in each group 1 day after transplantation. Immunofluorescent images (600 ×) from second to fourth arrays indicate cell nuclei (blue), PKCɛ (red) and GFP (green), respectively, and first array images (left side) are merged from second to fourth arrays. Bar graph shows GFP (+) cell count percents [(GFP (+) cell counts/total cell counts) × 100%], indicating that expression of PKCɛ (red) and retention of MSCs (green) increased significantly in the MSCs-PKCɛ group compared with controls, and increases were attenuated after treatment with AMD3100 or LY294002 (n=6). Data are means±S.D. for five different experiments (n=6). MSCs-GFP: AMI+MSCs-GFP group; MSCs-PKCɛ: AMI+MSCs-PKCɛ-GFP group; AMD3100: AMI+MSCs-PKCɛ-GFP+AMD3100 group; LY294002: AMI+MSCs-PKCɛ-GFP+LY294002 group; *P<0.05 versus MSCs-GFP group; †P<0.01 versus MSCs-GFP group; ‡P<0.05 versus MSCs-PKCɛ group; #P<0.05 versus AMD3100 group

