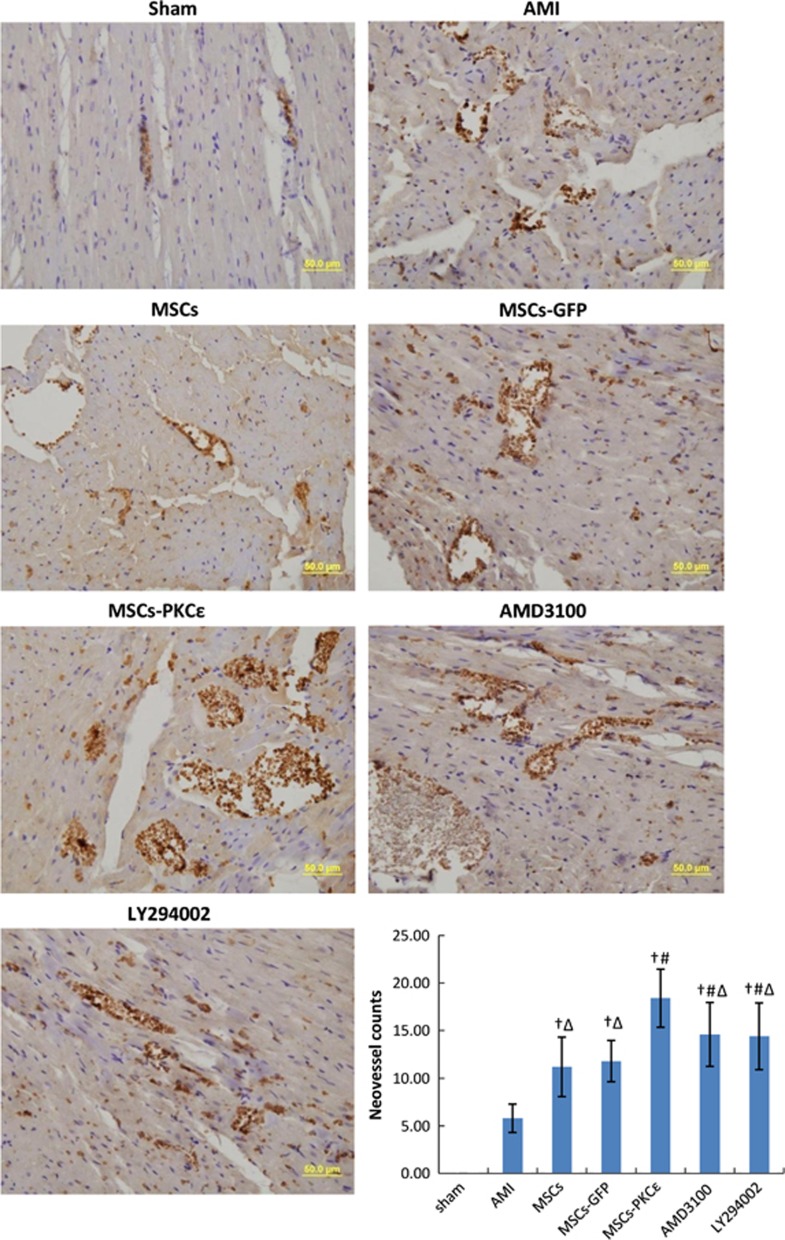
Figure 8.
Expression of factor VIII in each group at 4 weeks after transplantation (400 ×). Cell nuclei appear blue and factor VIII stains brown. Bar graph shows neovessel counts per group as assessed microscopically (400 ×), and data are means±S.D. for five different experiments (n=6). Data show that expression of factor VIII and neovessel counts increased significantly in the MSCs-PKCɛ group compared with controls, suggesting that PKCɛ contributed to expression of factor VIII and formation of neovessels. These effects were partly inhibited after treatment with AMD3100 or LY294002. Sham: sham group; AMI: AMI group; MSCs: AMI+MSCs group; MSCs-GFP: AMI+MSCs-GFP group; MSCs-PKCɛ: AMI+MSCs-PKCɛ-GFP group; AMD3100: AMI+MSCs-PKCɛ-GFP+AMD3100 group; LY294002: AMI+MSCs-PKCɛ-GFP+LY294002 group; †P<0.01 versus AMI group; #P<0.01 versus MSCs-GFP group; ΔP<0.05 versus MSCs-PKCɛ group

