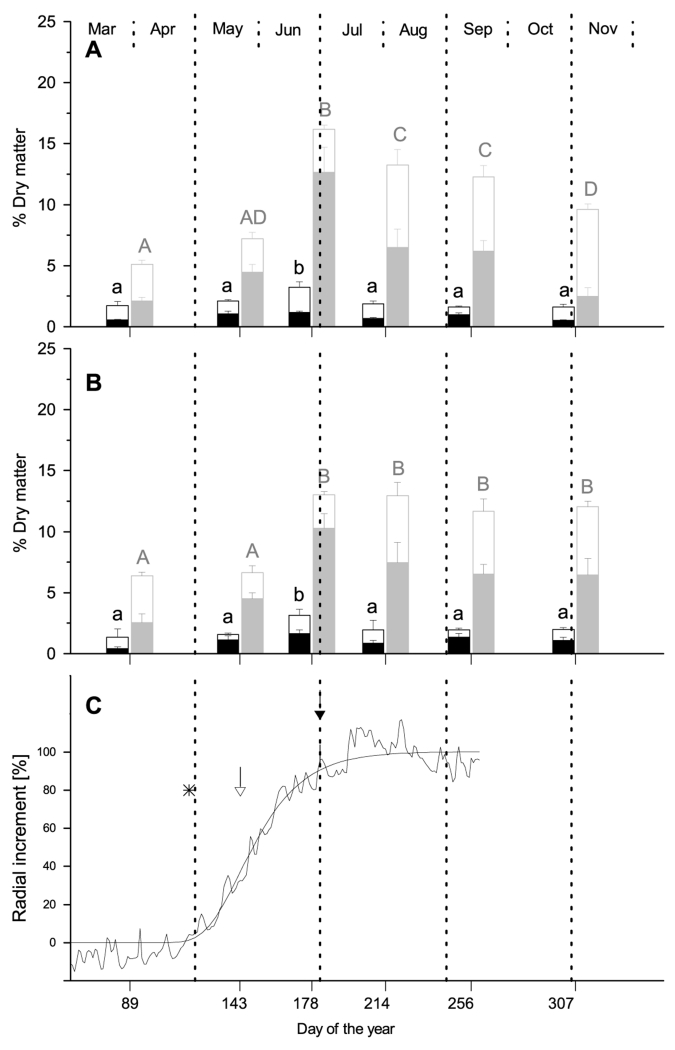
Fig. 2.
Mean concentrations of free sugars (open sections of bars) and starch (filled sections of bars) in xylem (black bars) and phloem (gray bars) of stems (A) and coarse roots (B) of Pinus cembra, at six sampling dates during 2011. Different letters indicate significantly different NSC concentrations among sampling dates (P < 0.05, lowercase letters: xylem; upper case letters: phloem). (C) Dynamics of xylem growth in 2011 modelled using the Gompertz function. The open arrow denotes time of maximal radial growth. The filled arrow denotes the time when 90% of increment were produced. Asterisks indicate time of bud break.

