Fig. 4.
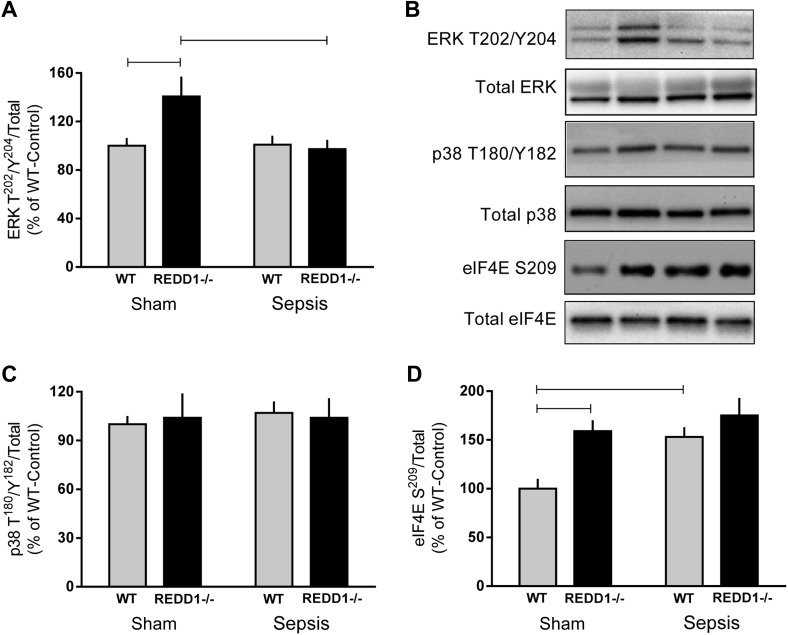
Alterations in ERK, p38, and eIF4E phosphorylation in skeletal muscle in response to REDD1 deletion and sepsis. Bar graphs represent the quantification of Western blot images relative to the total amount of the respective protein ERK Thr202/Y204 (A), p38 Thr180/Y182 (C), and eIF4E Ser209 (D) phosphorylation. Gray bars represent WT mice (n = 10 sham and 15 septic), and black bars correspond to REDD1−/− mice (n = 10 sham and 13 septic). All values are expressed relative to the sham-WT value, which was set to 100%. There was no significant genotype or sepsis effect on the total amount of any of the 3 proteins (data not shown). Horizontal bars indicate statistical differences between groups (P < 0.05). Values are expressed as means ± SE. B: representative Western blot images for the 4 treatment groups.

