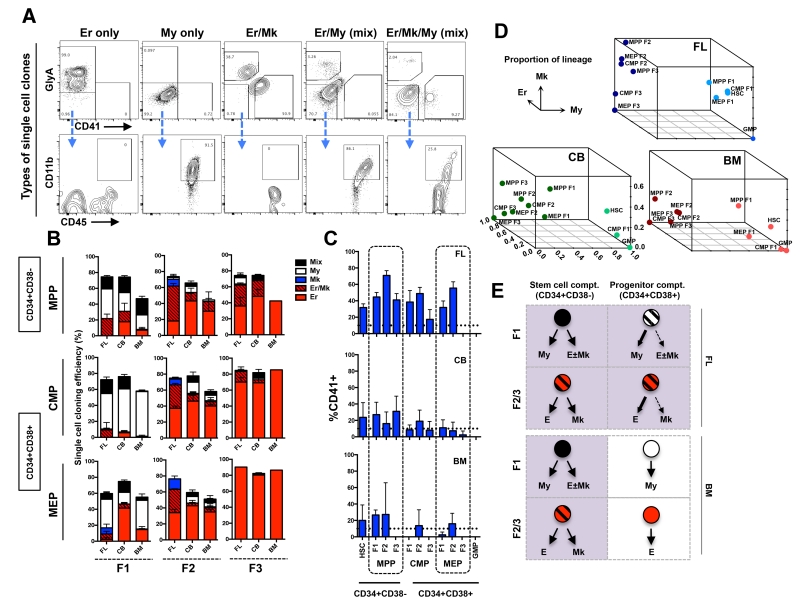
Figure 3. Lineage analysis of single cell derived clones from newly defined subsets of human MPPs, CMPs and MEPs.
(A) Single cell clones were analyzed by flow cytometry and binned into 5 distinct lineage outcomes. Erythroid clones were defined as GlyA+ only (Er only). Myeloid clones were identified as GlyA−CD41−, but CD45+CD11b+ (My only). Erythroid-megakaryocyte clones were defined as GlyA+ and CD41+ but negative for CD11b (Er/Mk). Mix clones were defined as the My cells (CD45+CD11b+) and Er cells (GlyA+) or Mk (CD41+) (column 4), or both (column 5). (B) Cloning efficiency and lineage outcomes of single cells from newly defined MPP, CMP, and MEP fractions (F1s, F2s and F3s) from FL, CB and BM. (C) Total Mk output (CD41+) from all newly defined subsets from FL, CB and BM. Bars indicate mean ± standard error. Total number of independent experiments: n=3, 6 and 4 for FL, CB and BM respectively. (D) 3-D summary of lineage outputs (My, Er and Mk) from all cellular subsets in FL, CB and BM presented in Fig. 3B. (E) Pictorial summary of the predominant lineage outcomes from stem (CD34+CD38−) and progenitor (CD34+CD38+) cell compartments in FL and BM data.

