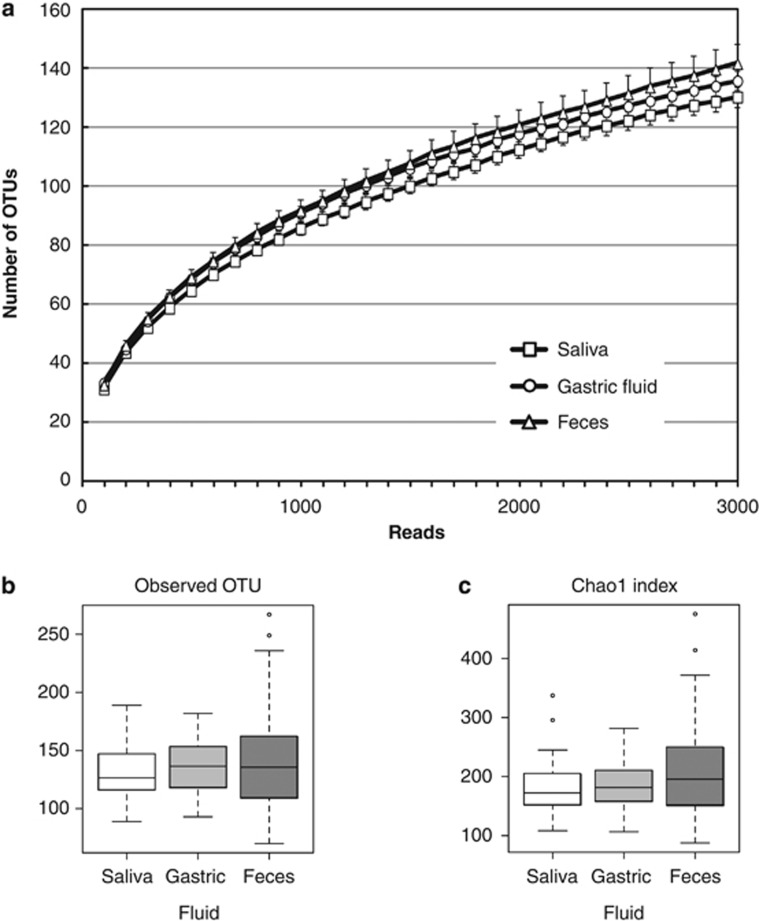
Figure 1.
Analysis of the operational taxonomic unit (OTU) number. (a) The rarefaction curve plots the number of OTU as a function of the number of reads. Squares, circles and triangles represent the curves for salivary, gastric fluid (GF), and fecal micobiota, respectively. (b and c) The OTU number representing the bacterial species richness of the microbiota was estimated using the (b) observed OTU and the (c) Chao 1 index.

