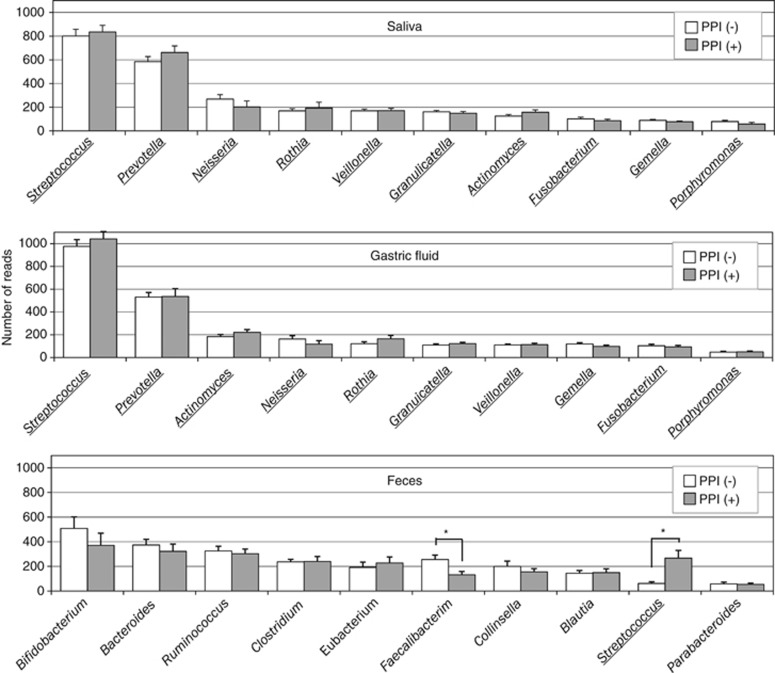
Figure 5.
Bacterial composition at the genus level. The average of read numbers of the top 10 major genera are shown in the salivary, gastric fluid (GF), and fecal samples. Open and filled bars represent proton-pump inhibitor (PPI)-nonusers and PPI-users, respectively. Underlining represents the common genus among the microbiota. Asterisks show a significant difference according to Student's t-test.

