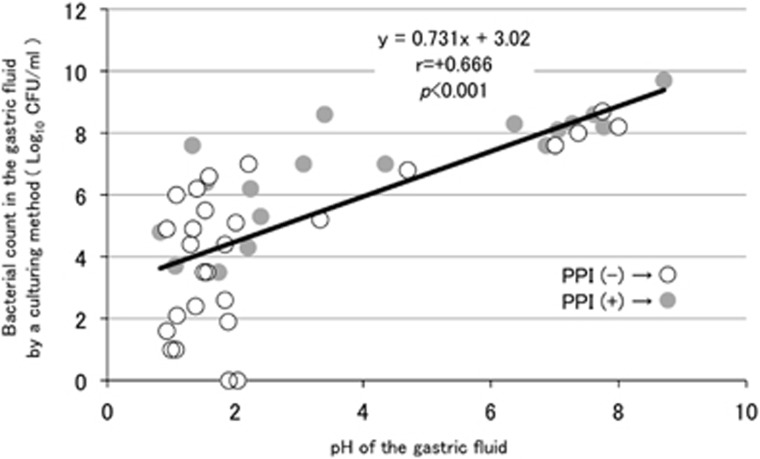
Figure 6.
The relation between the pH value and the bacterial count using a culturing method in gastric fluid (GF). The pH value (horizontal axis) and the bacterial count (vertical axis) according to a culturing method in the GF of each subject were plotted by a circle to evaluate Spearman's correlation coefficient. Open and filled circles represent proton-pump inhibitor (PPI)-nonusers and PPI-users, respectively.

