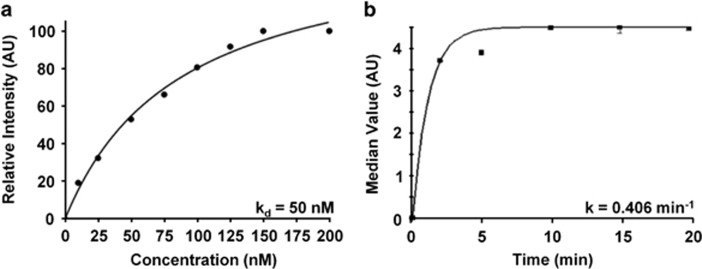
Figure 3.
Characterization of EGFR peptide-binding parameters. (a) Apparent dissociation constant kd=50 nm, R2=0.95 was measured for binding of QRH*-Cy5.5 to HT29 cells. (b) Apparent association time constant k=0.406/min (2.46 min) was measured for binding of QRH*-Cy5.5 to HT29 cells. Both results are representative of six independent experiments.

