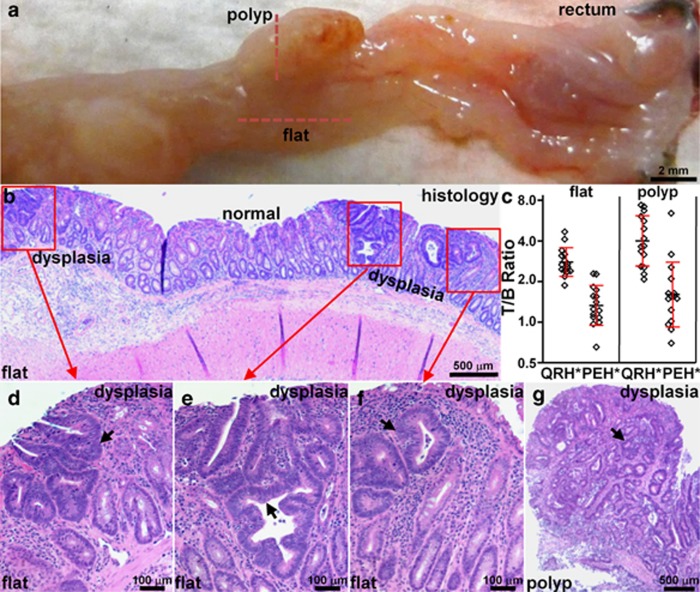
Figure 5.
Validation of colonic dysplasia on pathology. (a) Excised colon from Figure 4 shows locations of flat lesions and polyp (dashed red lines), Bar = 2 mm. (b) Histology (H&E) of flat lesion shows nonpolypoid mucosal morphology and foci of low-grade adenomatous dysplasia (red boxes) separated by intervening regions of normal mucosa, Bar=500 μm. (c) Greater mean fluorescence intensities from polyps (n=15) and flat lesions (n=15) were found compared with those from adjacent normal mucosa, T/B ratio 4.0±1.7 and 2.7±0.7, respectively. For polyps, mean±s.d. of the T/B ratio (log2) for QRH*-Cy5.5 and PEH*-Cy5.5 was 1.90±0.60 and 0.62±0.77, P=4.1 × 10⁻⁴ by paired, two-sided t-test, respectively, and mean fold difference was 2.43. For flat lesions, the results were 1.39±0.34 and 0.36±0.47, P=7.4 × 10⁻⁶ by paired, two-sided t-test, and mean fold difference was 2.05. (d–f) Magnified view of red boxes in b shows histological features of low-grade dysplasia (arrows). (g) Histology (H&E) of polyp along vertical red line in a shows identical histological features of dysplasia. H&E, hematoxylin and eosin; T/B, target-to-background.

