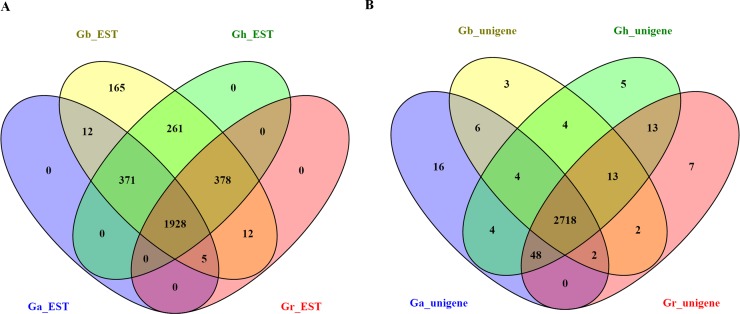
Fig 2. The distribution of uniESTs in four reference cotton species obtained using four different cotton species EST databases and unigenes from different cotton subspecies genome databases.
Venn diagrams showing the uniESTs in each of the four different cotton species EST databases (A) or unigenes from different cotton subspecies genome databases (B), with the overlapping regions corresponding to the number of uniESTs present in more than one species. The central region corresponds to the uniESTs present in all four species.

