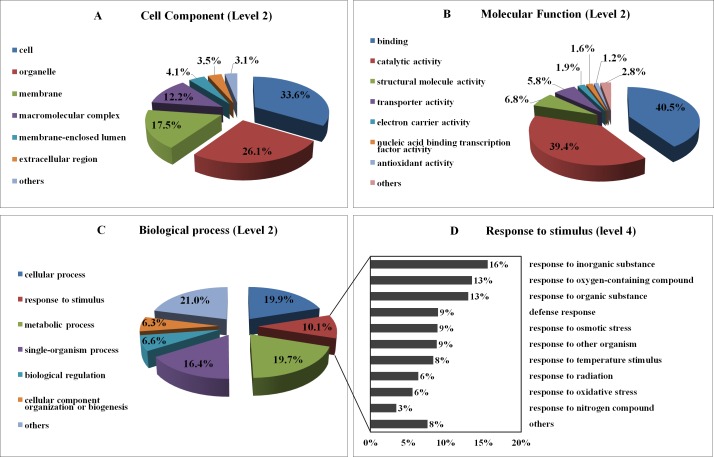
Fig 4. Functional classifications of 2,678 uniESTs that were assigned GO terms.
Tortadiagrams represented the second-level GO terms for three categories: cellular component (A), molecular function (B) and biological process (C). The histogram represents the GO term ‘Response to stimulus’ at level 4 (D).

