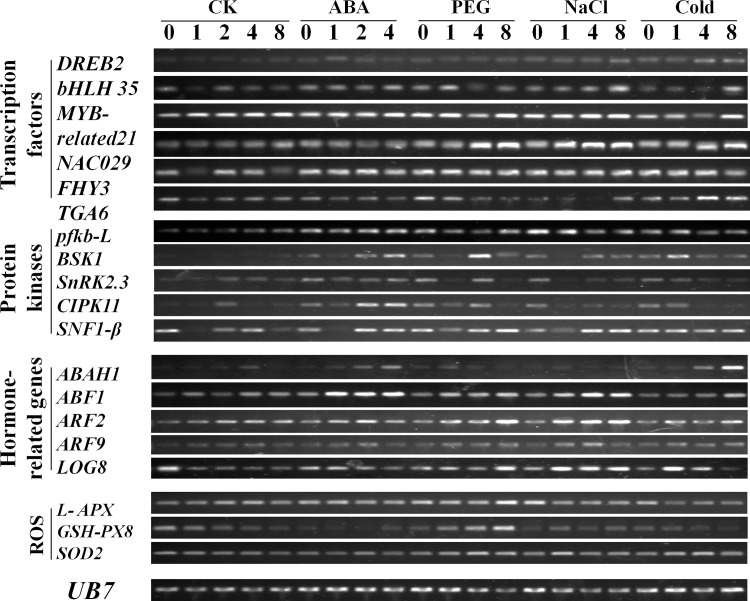
Fig 7. RT-PCR analysis of selected genes under different abiotic stress environments.
0, 1, 2, 4, and 8 refer to samples from different time points (0 h, 1 h, 2 h, 4 h, and 8 h) after treatment by different stress factors (200 mM ABA as ABA, 15% PEG as PEG, 200 mmol L-1 NaCl as NaCl and 4°C as cold).

