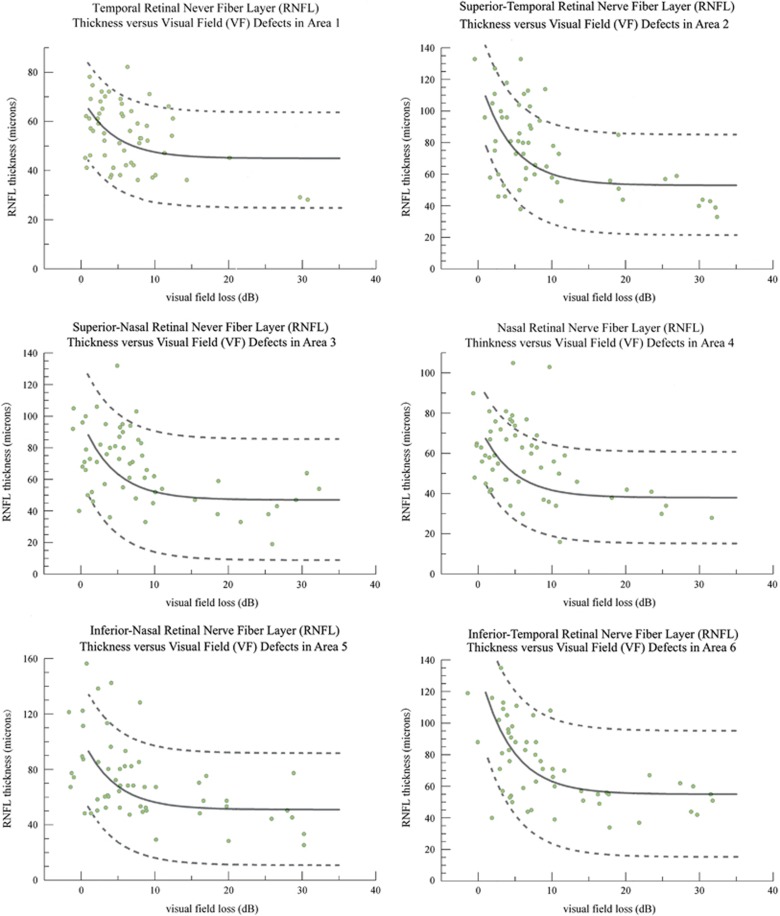
Figure 2.
Structure–function correlation between local retinal nerve fiber layer (RNFL) thickness and corresponding visual field (VF) defects in all six sectors. The solid line in each graph represents the theoretical log-linear relationship between RNFL thickness (TM) and VF defect value (D). The dashed lines represent the 95% confidence intervals of the prediction curves. The measured values TM and D of each sector are presented in corresponding log-linear plot.

