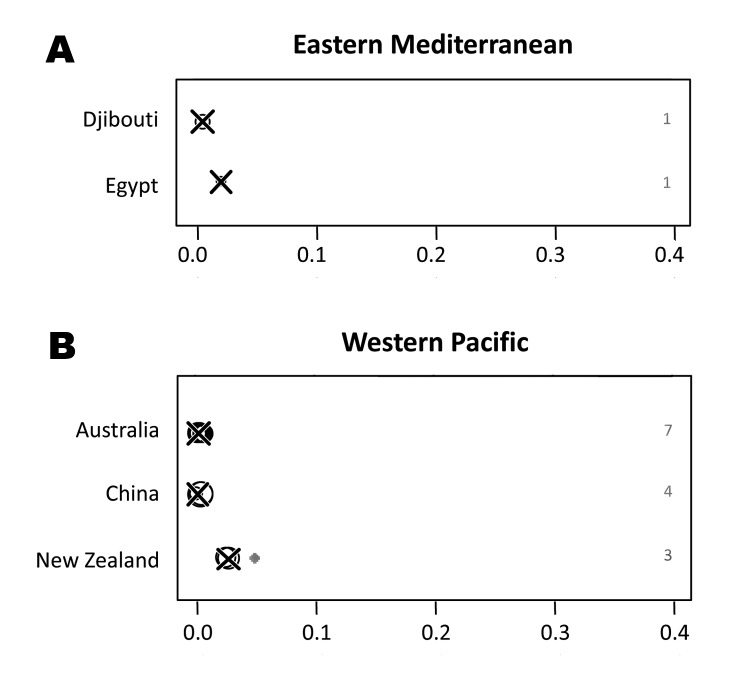
Figure 6.
Proportion of zoonotic tuberculosis (TB) among all TB cases stratified by country: A) Eastern Mediterranean; B) Western Pacific. x-axis values are median proportions. Each circle represents a study with the circle diameter being proportional to the log10 of the number of isolates tested. A gray rhombus indicates that the number of samples tested was not reported or could not be inferred from the data available. The median proportion of all studies for a given country is indicated by X. Numbers on the right side of the figures indicate the number of studies included for any given country.

