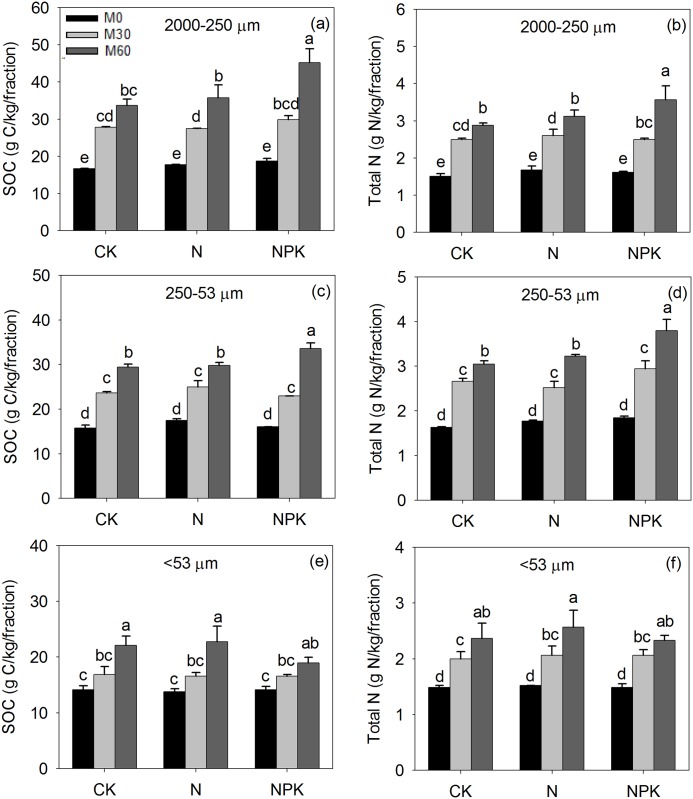
Fig 2. The content of soil organic carbon (SOC) in 2000–250 μm (a), 250–53 μm (c), <53 μm (e) fraction and total nitrogen (N) in 2000–250 μm (b), 250–53 μm (d), <53 μm (f) fraction from the control (CK) or soil that received 32 years of chemical fertilizer application (N, P: phosphorus, K: potassium) and either 0 (M0), 30 (M30) or 60 (M60) t manure ha-1 yr-1.
Note: Different letters above the bars indicate significant differences at 5% probability level. Capped bars are standard error of the mean (n = 3).

