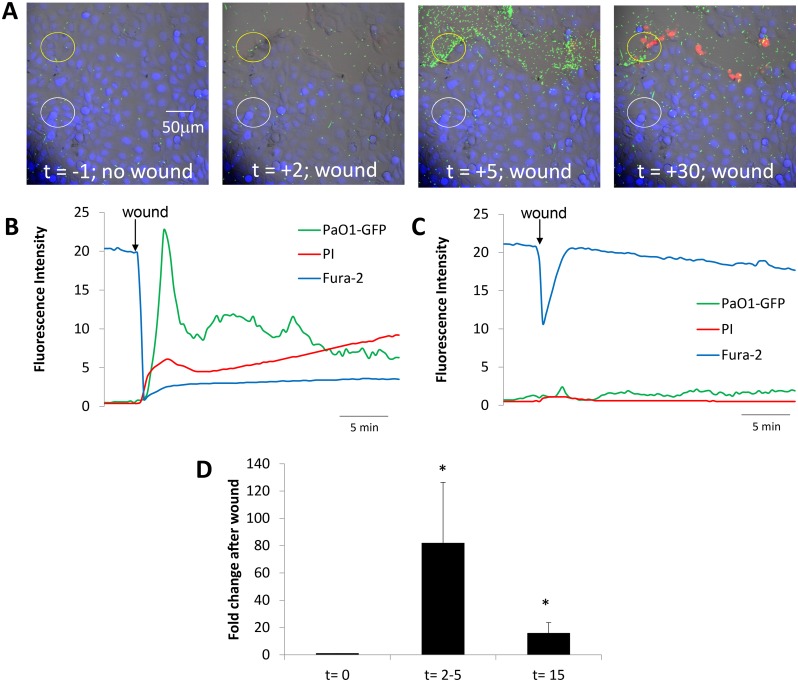
Fig 1. Time course of changes in CFBE41o- epithelia and PAO1-GFP following wounding.
A. Images from S1 Movie showing overlays of DIC, fura-2 (blue), PI (red nuclei) and PAO1-GFP in control conditions (t = -1 min) and after wounding CFBE41o- cells (t = 2, 5 and 30 min). B. Quantitation of PAO1-GFP (green trace), live epithelial cells (blue) and dead epithelial cells (red) in the region of the wound shown by the yellow circle in A under control conditions and then following wounding (arrow). Fluorescence intensities were measured on background-subtracted images and expressed in arbitrary fluorescence units. C. Quantitation of PAO1-GFP (green trace), live epithelial cells (blue) and dead epithelial cells (red) in the adjacent non-wound region (white circle in A) under control conditions and then following nearby wounding (arrow). D. Average number of PAO1-GFP (normalized to bacteria in field before wounding) in the epithelial wounds (i.e., in regions shown by yellow circles in A) during control conditions (t = 0 min), at peak of bacterial migration to the wound (2–5 mins) and when bacteria returned to random swimming but some remained immobilized on both dead and live cells near the wound (t = 15 mins). Data are avg +/- SD (n = 5 experiments).

