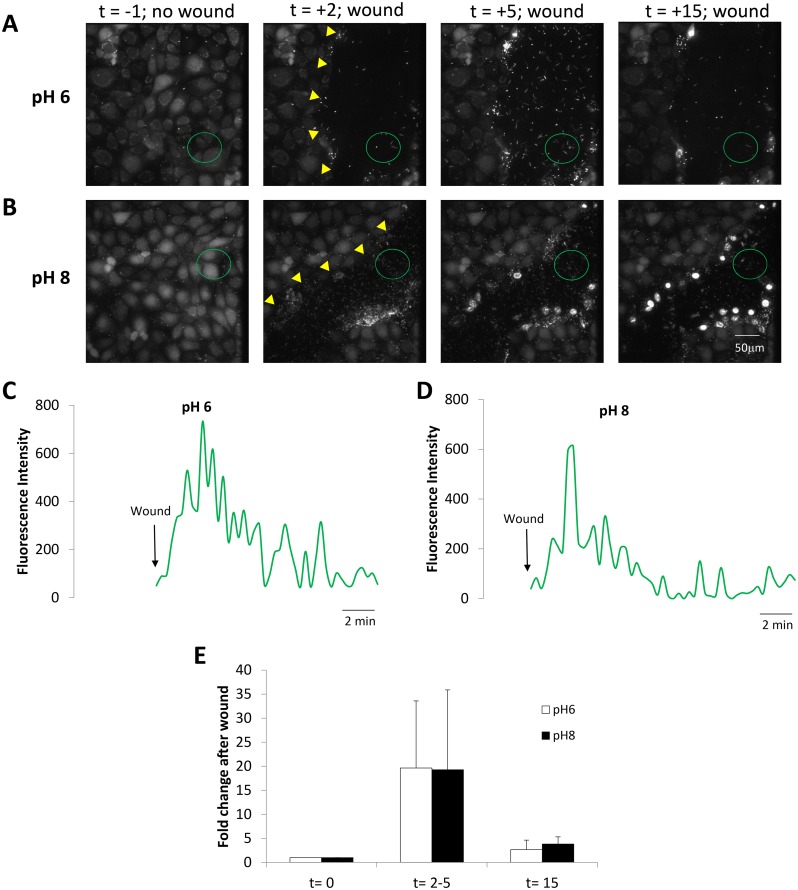
Fig 4. Similar responses of PAO1-GFP to wounds in CFBE41o- cells incubated in pH 8 vs pH 6 solutions.
CFBE41o- cells (labeled with BCECF to for visualization) incubated in Ringer buffered to pH 6.0 or pH 8.0 and containing PAO1-GFP (2 MOI) were wounded and imaged. A. Images from S6 Movie showing PAO1-GFP and epithelial cells bathed in pH 6 Ringer in control conditions (t = -1 min) and after wounding (edge of wound marked by yellow triangles) epithelial cells (t = 2, 5 and 15 min). B. Images from S7 Movie showing PAO1-GFP and unlabeled epithelial cells bathed in pH 8 in control conditions (t = -1 min) and after wounding (edge of wound marked by yellow triangles) epithelial cells (t = 2, 5 and 15 min). C. Quantitation of PAO1-GFP near the wounded CFBE41o- cells (green circle in A) bathed in pH 6 Ringer beginning when wound removed epithelial cells (arrow). D. Quantitation of PAO1-GFP near the wounded CFBE41o- cells (green circle in B) bathed in pH 8 Ringer beginning when wound removed epithelial cells (arrow). E. Average number of PAO1-GFP (normalized to bacteria in field before wounding) in the epithelial wounds (i.e., in regions shown by green circles in A and B) during control conditions (t = 0 mins), at peak of bacterial migration to the wound (2–5 mins) and after 15 mins for the pH 6 and pH 8 experiments. Data are avg +/- SD (n = 4–5 experiments).

