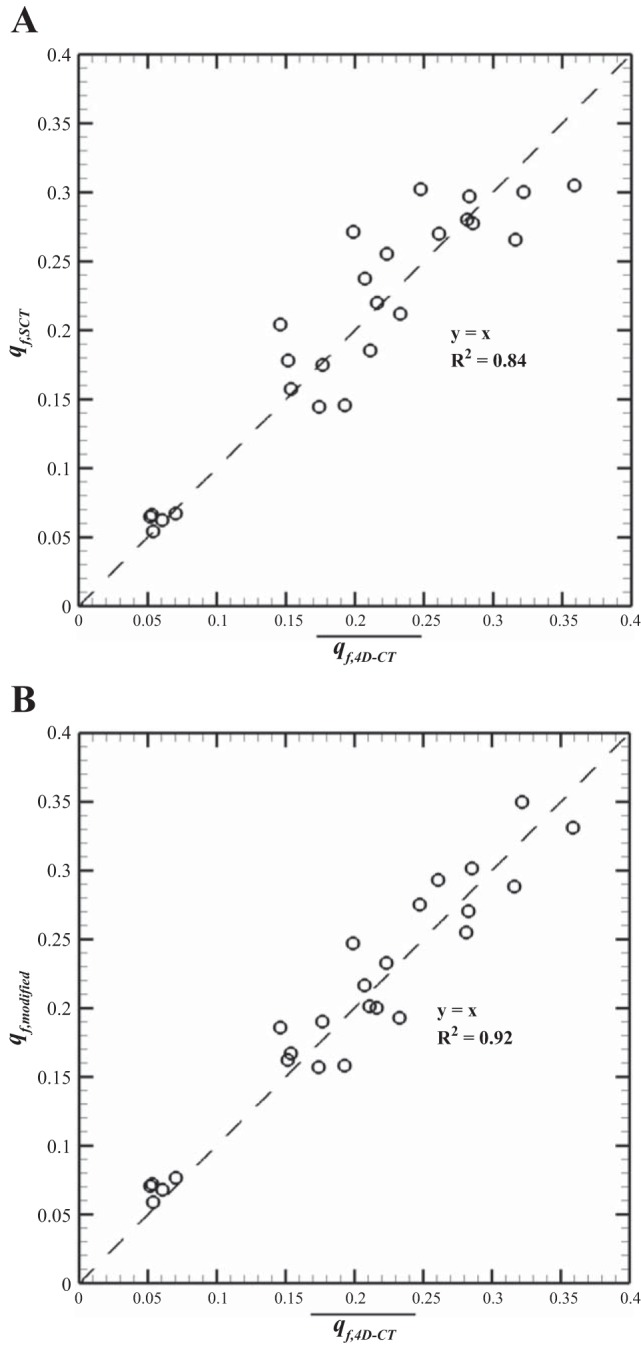
Fig. 7.

Linear regression between lobar qf of static images (functional residual capacity-total lung capacity, FRC-TLC) and average qf of dynamic (end exhalation-end inhalation, EE-EI) (A) and between lobar average qf of dynamic (EE-EI) and qf modified from static images (FRC-TLC) (B) for the 5 lobes of the 5 subjects. The values of 2 data points in the right middle lobe are too close to each other; thus it appears that there are 24 data points instead of 25.
