
Figure 2. Elevated MCT1 levels are indicative of tumor malignancy and poor breast and lung cancer patient survival.
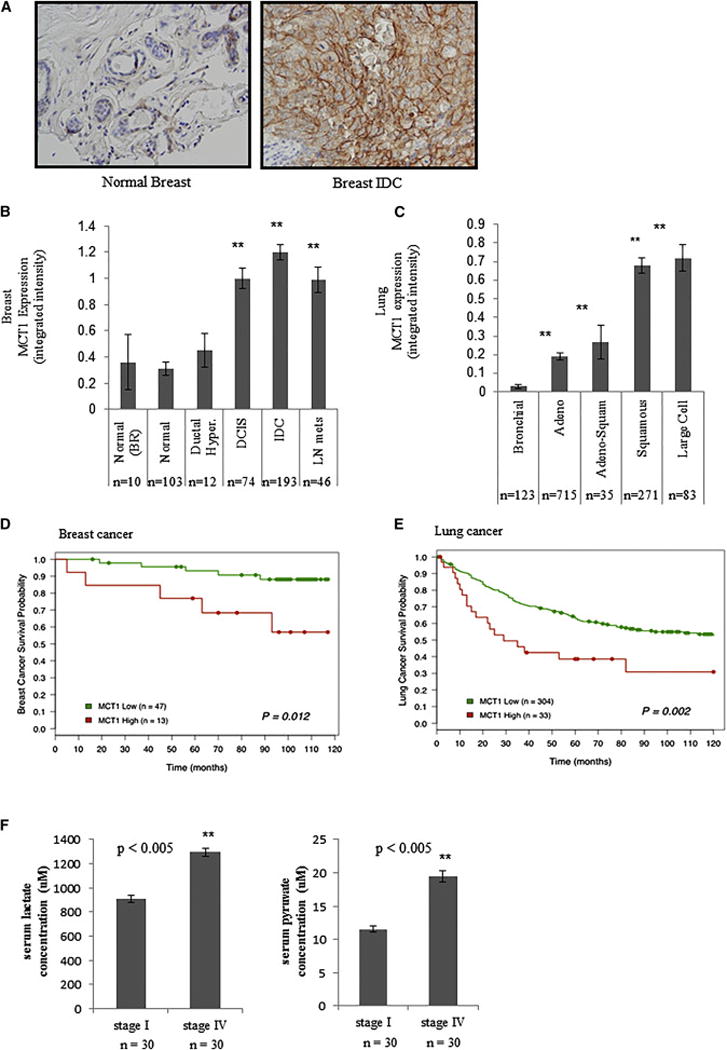
a, Immunohistochemistry of human normal breast and breast invasive ductal carcinoma (IDC) with an antibody towards MCT1 indicates higher MCT1 expression in the malignant tissue. Images are shown at X 100 magnification. b, The mean integrated MCT1 expression as determined by immunohistochemistry on a breast tissue microarray is compared across breast histologies and histopathologies. MCT1 expression is significantly increased in ductal carcinoma in situ (DCIS, P = 0.003), invasive ductal carcinoma (IDC, P < 0.001), and lymph node metastatic lesions (LN mets, P = 0.004) compared to adjacent non-malignant glandular epithelium (“normal”) or epithelium from voluntary breast reductions (BR). There is no significant difference between normal breast glandular epithelium and ductal hyperplasia (Ductal Hyper.) lesions. c, The mean integrated MCT1 expression as determined by immunohistochemistry on a lung tissue microarrary is compared across lung histologies and histopathologies. MCT1 expression is significantly increased in adenocarcinoma (Adeno, P < 0.001), adeno-squamous (Adeno-Squam, P < 0.001), squamous cell (P < 0.001) and large cell (P < 0.001) compared to adjacent non-malignant bronchial epithelium. Expression of MCT1 is significantly elevated in squamous and large cell tumors compared to adenocarcinomas and adeno-squamous tumors (P < 0.001 for both). For b, c, error bars denote standard error of the mean, and n = number of tissue array spots analyzed. d, Higher MCT1 expression levels predicts poorer survival in women with invasive ductal carcinoma of the breast. Kaplan-Meier survival plot shows patients with lower MCT1 expression (< 2.0 mean integrated intensity) depicted as a green line, and higher MCT1 expression (≥ 2.0 mean integrated intensity) depicted as a red line. e, Higher MCT1 expression levels predict poorer survival in individuals with NSCLC. Kaplan-Meier survival plot shows patients with lower MCT1 expression (≤ 1.0 mean integrated intensity) depicted as a green line and higher MCT1 expression (> 1.0 mean integrated intensity) depicted as a red line. f, Serum lactate (left) and pyruvate (right) concentrations from Stage I versus Stage IV lung cancer patients. For d, e, f, n = number of individuals in each category.